
Spark UI is a good method to track jobs execution and detect performances issues. But the multiple parts of the UI, some of them depending on used Spark library, can scare at first glance. This post tries to explain all necessary points to understand better the common parts of Spark UI.
The post is divided in short sections. Each of them uses the screens of really executed tasks to explain different parts of Spark UI. The post contains only the explanation for the metrics shared by different Spark modules (batch, SQL, streaming). One of subsequent posts will describe the tabs specific for each of these modules.
Jobs tab
The first page after arriving at Spark UI shows the jobs - active and already terminated ones. Reminds you, the job is the highest abstraction in Spark applications. It represents the global view of processing. You can learn about the composition of Spark programs in the post about Jobs, stages and tasks. The following screen shows the principal view of jobs tab:
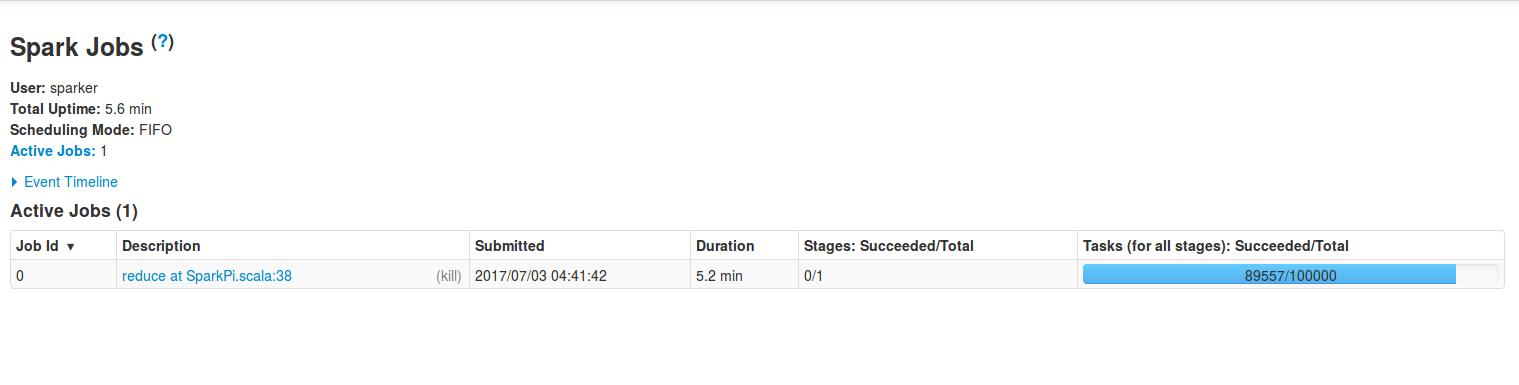
During debugging, tuning or simply monitoring, you should keep your attention on the points mentioned below:
- Duration - if for some reasons one job takes more than to finish than the others, it can be a sign of ineluctable incoming problems.
- Stages: Succeeded/Total - represents the number of stages for given job. Obviously, if there are some of failing stages, it should alarm you.
- Tasks (for all stages): Succeeded/Total - as in the case of stages, it contains the number of all planned tasks. Similarly, in the case of errors, it'll show the number of failures. Any failure should also be analyzed. It may be the beginning of the failure for the task holding this stage.
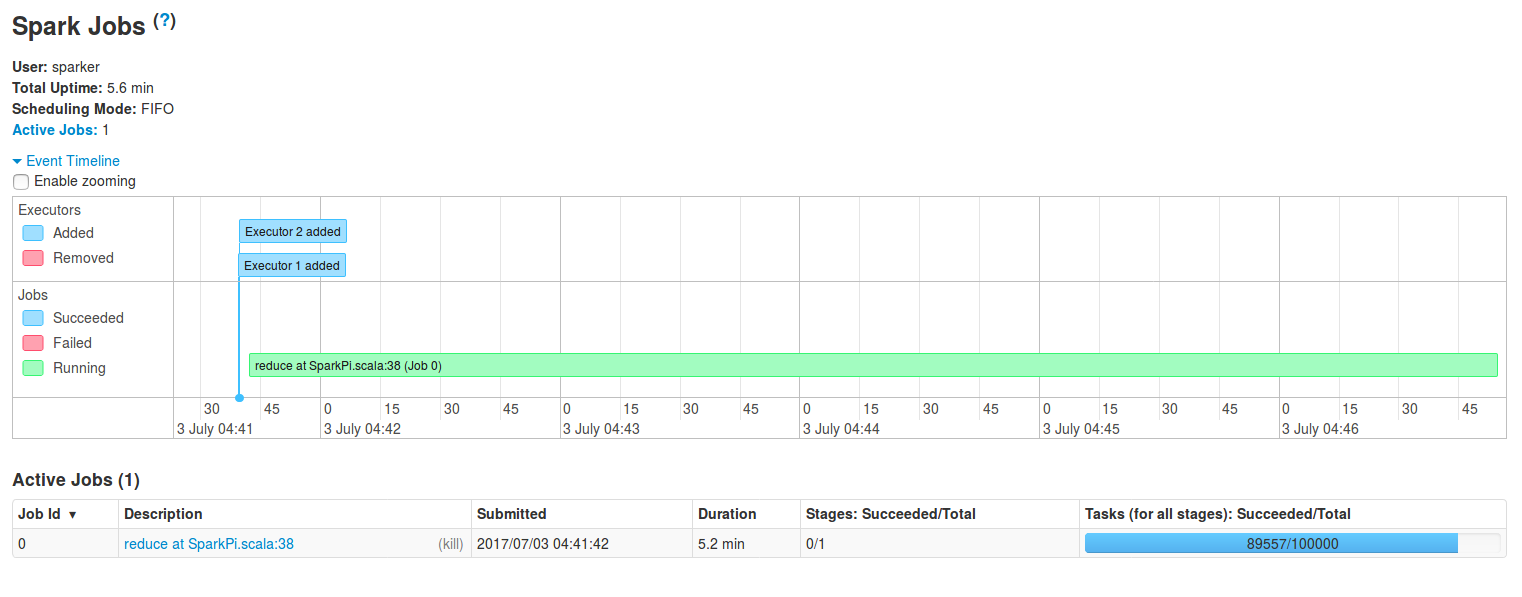
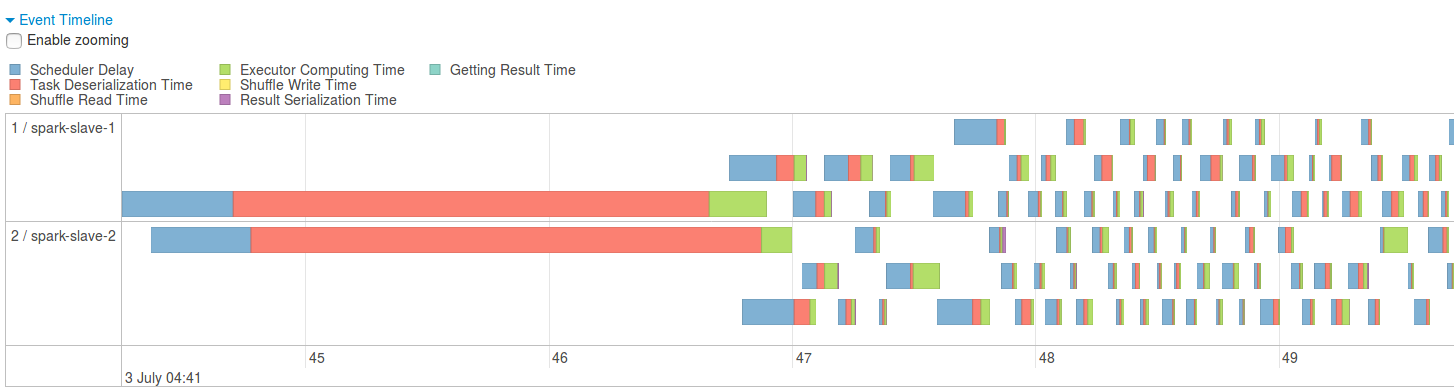
An interesting point about this tab is the part of Event timeline link. After clicking on it, a timeline of principal events occurred during processing will be displayed. Thanks to this part we can see, for example, when the executors were added or which jobs were running in particular time intervals. The first point is particularly interesting if the dynamic resource allocation is enabled. If you don't know a lot about this option, you can read the post about dynamic resource allocation in Spark.
Stages tab
Another part related to executed code is included in stages tab. As you know (if not, you can read the mentioned post about jobs, stages and tasks), stages are the composition of a job. Logically, they provide more details than the jobs. And it's visible in the following image, representing all executed stages for a particular job:
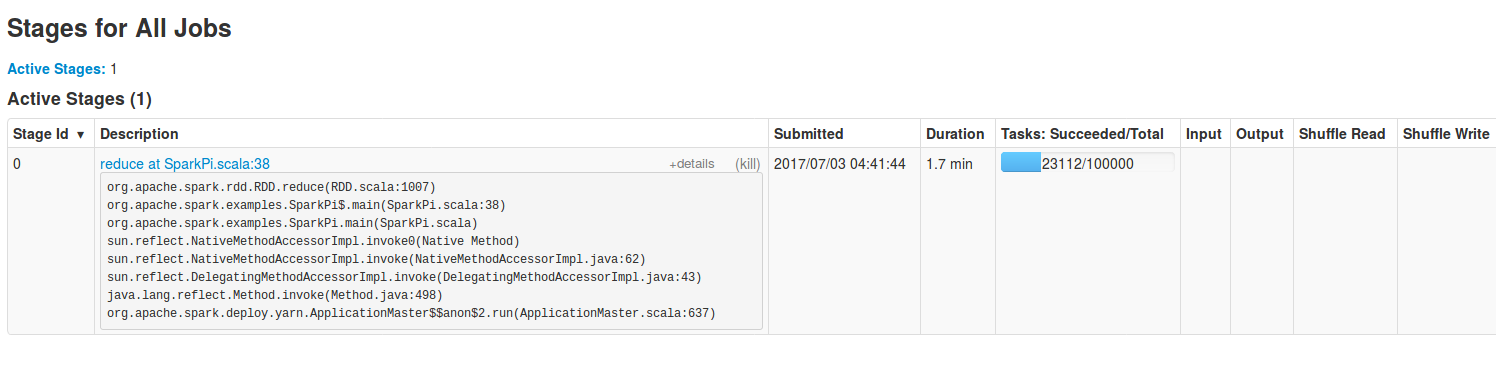
Stages tab, as the jobs one, also contains some interesting global metrics. The screen below shows the view of all active stages. As in the case of jobs, any failed stage should alarm you. It's also important to track the activity of input/output and shuffle reads/writes. Maybe during some period of time there are much more data to process that can slow down the performances or even make some of tasks fail.
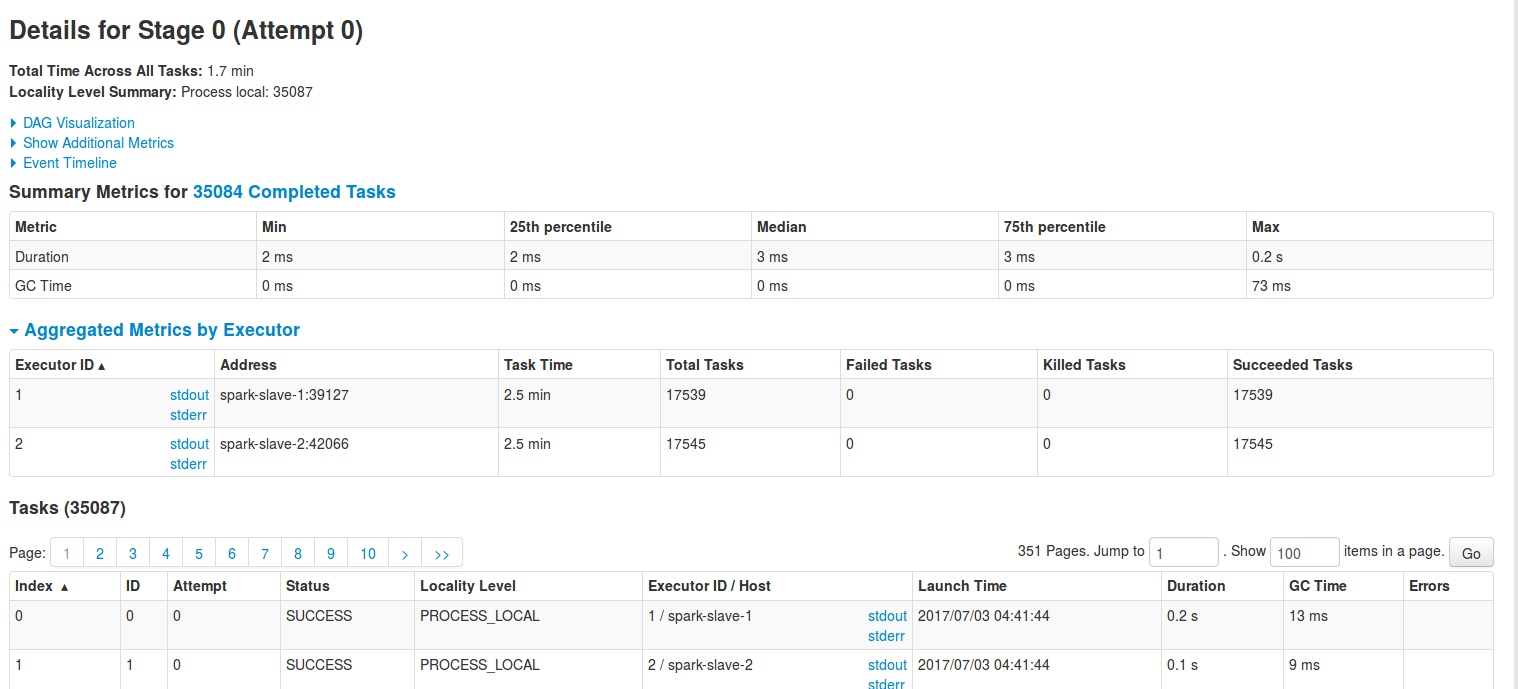
Except global metrics, stages tab has also more detailed information about the execution. In particular, the interesting part is the Aggregated Metrics by Executors. It's helpful to understand how the tasks are balanced. It can be also used to determine how given executor performs. If for a particular executor the number of failing tasks starts to grow, it can be a sign that in some time it can be killed:
Also Event timeline provides a lot readable information about the tasks execution. It helps to see if there are some tasks different than the others - maybe taking more time to schedule or to compute the results. All of these parts composing task's execution time are colored. It's quite easy to distinguish quickly which tasks are much more different than the rest:
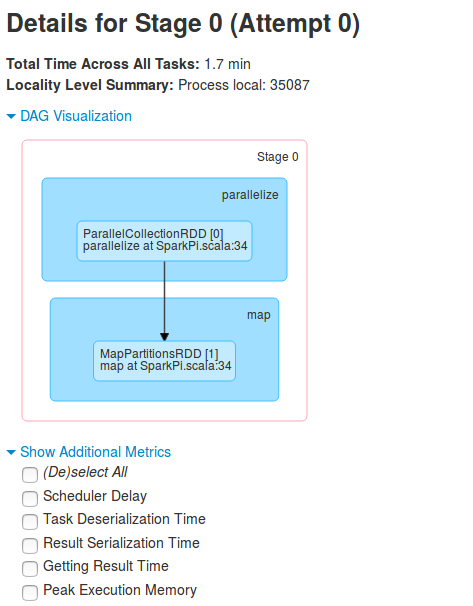
Another helpful visual information is shown after clicking on DAG Visualisation link. The collapsed DAG graph helps to understand what happens after the translation of processing code to DAG of execution. It can also show pretty quickly the inconsistencies between stages - for instance maybe you could reorder or skip some of them in order to reduce the complexity ?
Tasks tab
More fine-grained level than stages are tasks. In fact one or more task composes each stage and it's illustrated very good by the below screen taken in the bottom of Stages tab:
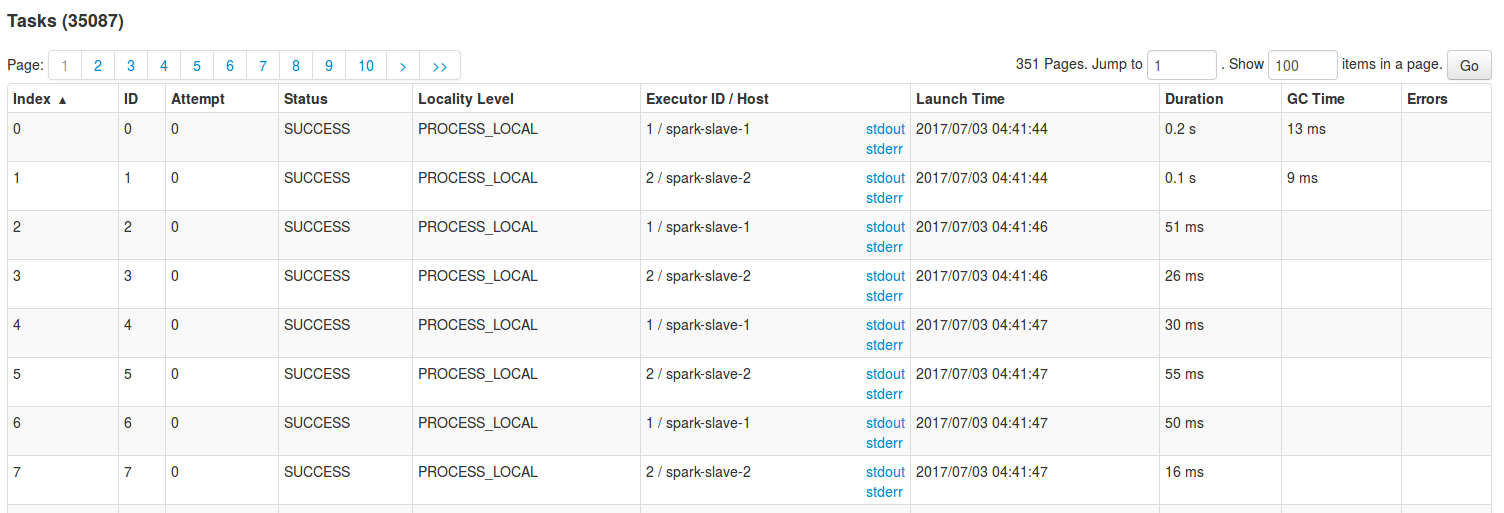
As you can see, the level of details is more fine grained and the important parts are:
- Attempt tells you how many times given task was already executed. Obviously, some of these executions finished with failures. So the number greater than 1 should interpellate you.
- Status defines if the task terminated successfully or not.
- Executor ID/Host, or rather the stdout and stderr links, are quite important here if we want to read the logs related to the particular task.
- Launch time - the interval between subsequent tasks shouldn't be too big. For instance, if some of the tasks in the above picture started 30 seconds after other ones, it could be an investigation point.
- Duration informs how long Spark took to execute given task. As in the case of launch time, the values here should also be equilibrated. For instance, having a task terminated within 0'30 and another one within 1'30 could require some analysis (maybe the data is not balanced properly?)
- GC Time represents the time that JVM needed to execute the GC. This time makes part of Duration. If the GC occurs too often, it will reduce the responsiveness of each task and, maybe in the nearest future, lead to OOM problems on executors running GC intensive stages
Storage tab
The next tab called storage lists the elements persisted by Spark. For instance, it can show the data generated by stateful operations (below image), cached RDDs, blocks generated by receivers (streaming applications).
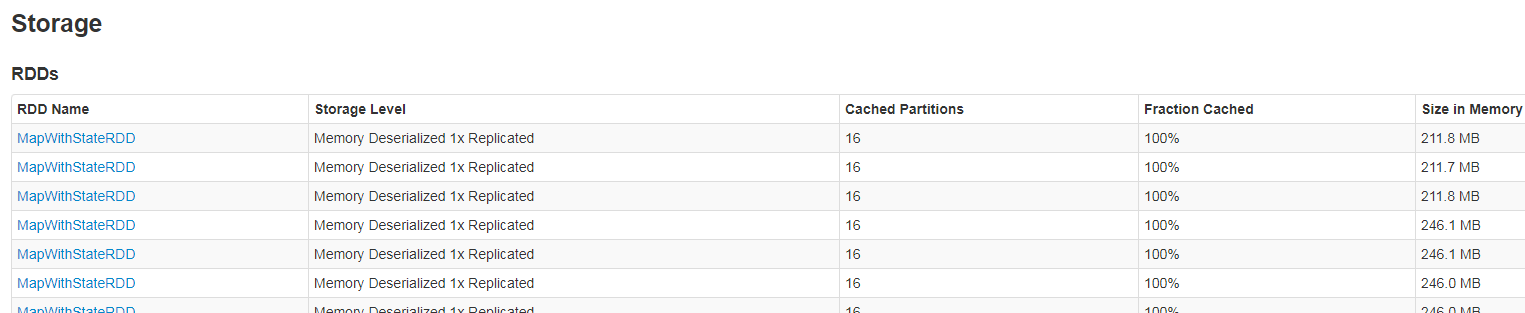
Please notice that often this tab is empty. If the RDDs aren't persisted and the application doesn't use receivers or stateful operations, it's normal.
Executors tab
The executors tab complements the information returned by the storage one. It exposes a global view for executors performances and shows their load:
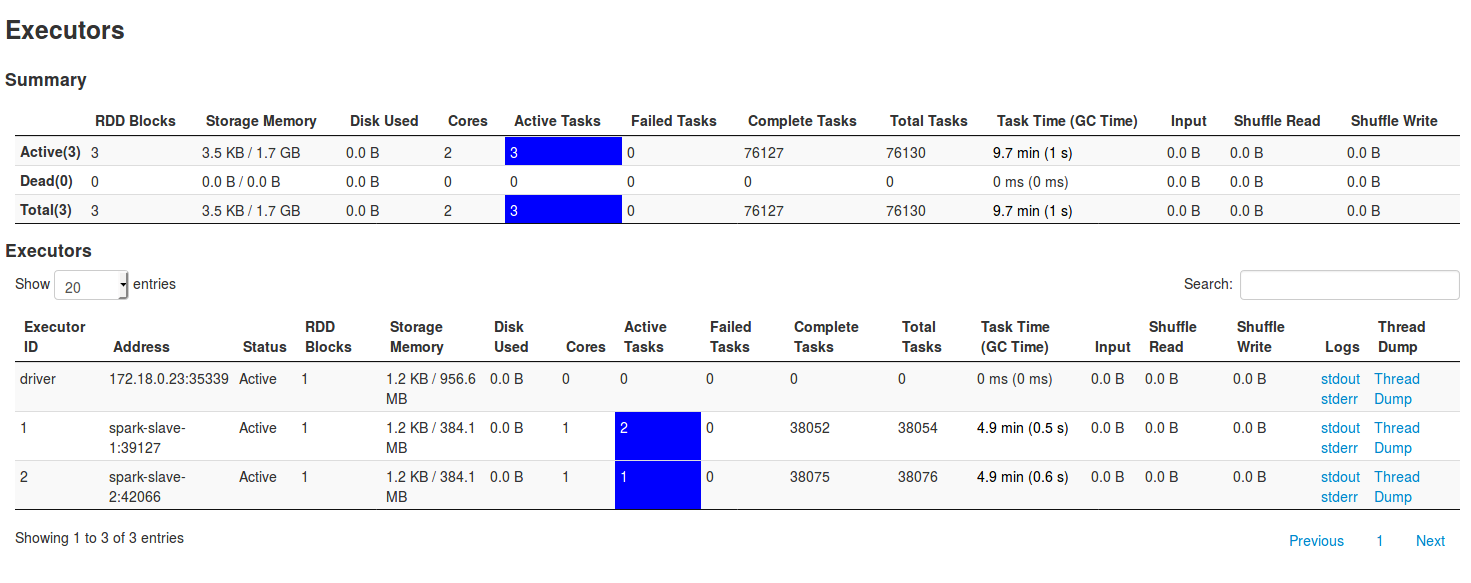
From the important parts, you can observe Summary part, where RDD blocks, Storage memory, Complete tasks should be as equilibrated as possible. If one of executors has one of these values much bigger than the others, it could be a sign of bad data distribution. For instance, in the case of Spark Streaming jobs using receivers, it can occur that one of executors will load all data and in consequence, have the mentioned parts much bigger than the others (note that it can occur if only 1 DStream is defined instead of unified DStreams). It's also important to track the number of failed tasks. If it's too big, it can mean that given executor will fail in nearest future. Also the stats about input and shuffle are important. They're a good indicator about data partitioning. The following picture shows this unbalanced situation:
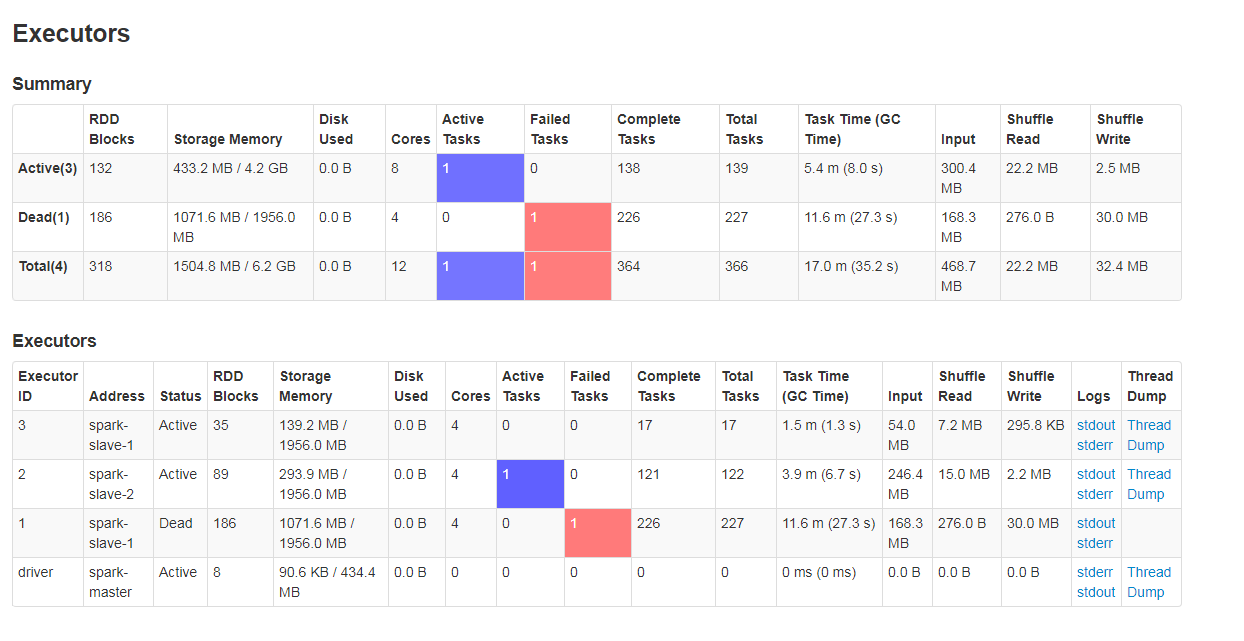
Another important part of main executors tab is the section under Executors. Except already quoted items, we'd take care of the Task Time (GC Time) column. In fact, if some of executors spend more than 10% of their time on making GC, the corresponding rows will be marked in red (the image above shows that). It can also be a sign of bad repartition, especially if the number of RDD blocks is much bigger than in the case of other executors.
The Executors table contains also a link opening the page about the threads running on given executor:
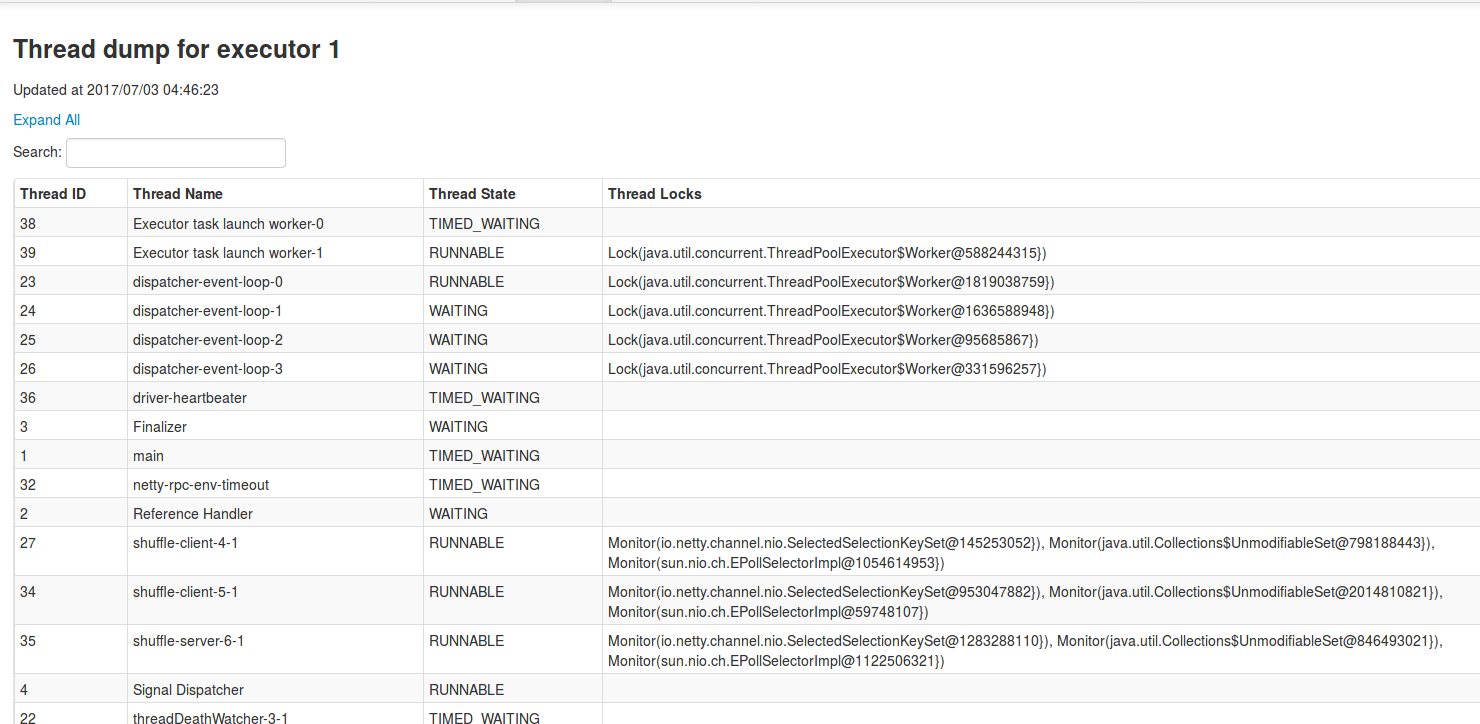
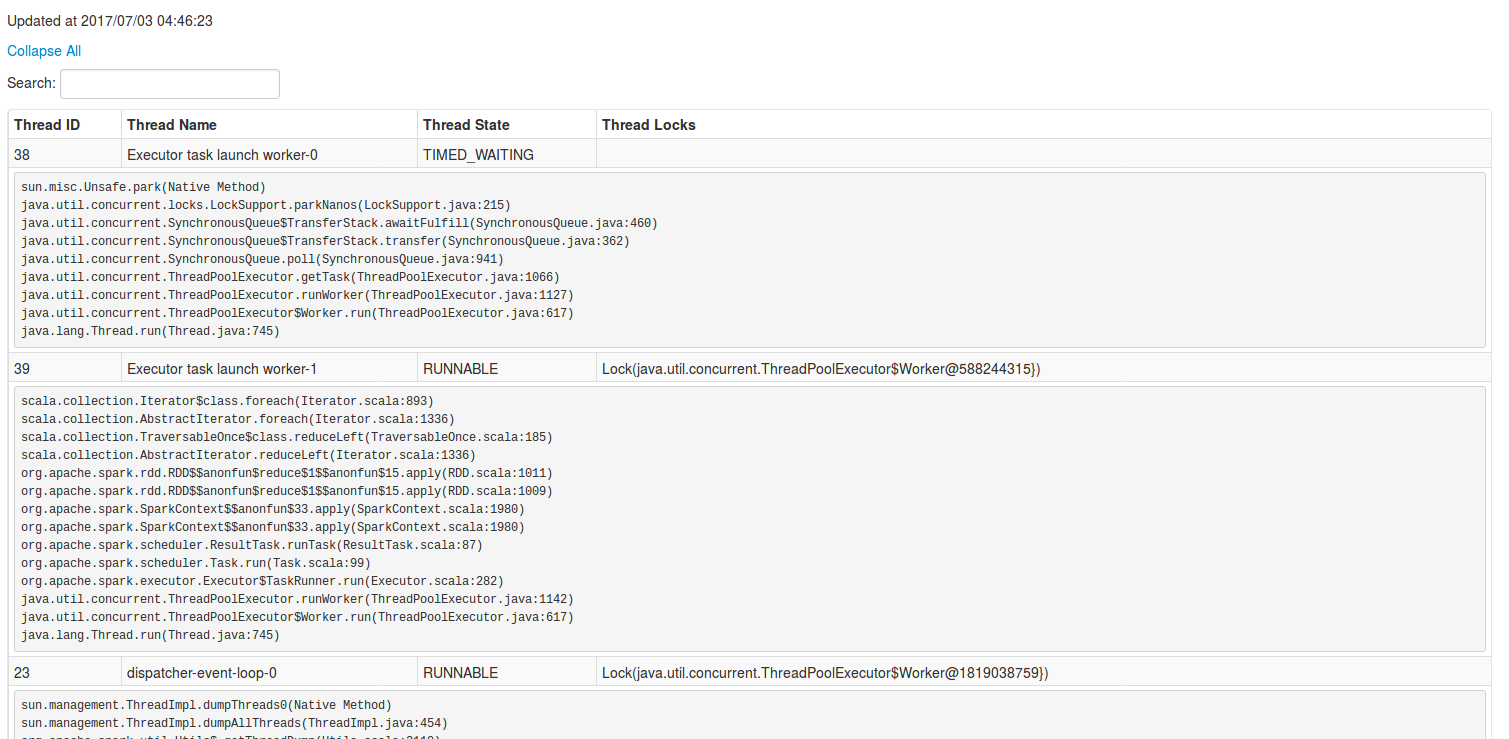
As shown in above picture, this part presents running or idle threads with the code context that can be opened after click on the row:
There are also an Environment tab. But it contains only the configuration used in the application and it's the reason why it was omitted in this post. Unlike the parts describing jobs and stages, presented in 3 first sections. Thanks to them we could learn which parts are shown and how many of them should be monitored with fully attention. The next 2 sections described the tabs more related to storage and executors.