
HyperLogLog algorithm described some weeks ago is not the single one approximate solution in the world of Big Data applications. Another one is Count-min sketch.
This post explains the Count-min sketch approximate algorithm. Its first section introduces the problem it tries to solve - heavy hitters. The next one shows how does this algorithm work. The final part gives an example of its implementation in Algerbird.
Heavy hitters problem
The Count-min sketch helps to solve different kinds of problems but probably the most known is the problem about heavy hitters. Even though the name can appear mysterious at first glance, it becomes quite obvious after some explanations.
The heavy hitters problem focuses on the retrieval of all elements appearing at least x% times in a given data stream. This problem can be solved accurately by tracking the occurred events separately and dividing each of them by the number of total events registered up to the computation moment. It seems to be simple and quick but in fact, especially in the Big Data and streaming applications, tracking the events in such way can be inefficient. Thus the alternative solutions, based mainly on approximate algorithms, exist and one of them is the Count-min sketch.
Besides the frequency problem we can classify the use of Count-min sketch in the following categories of queries:
- point query - retrieves the estimated number of occurrences for one particular event
- inner product query - computes the inner product of 2 vectors. It may be used to estimate the join size in relational query processing.
- range query - counts the sum of elements between 2 range values and answers to the question about how many values in the stream have a value between these ranges. For intance we can assume that every vector index corresponds to a different country: 0 - 100 to European countries, 101 - 200 to North American countries and so on. Now if we want to retrieve all visitors from Europe, we would query the range [0, 100] and compute its sum.
How does Count-min sketch work ?
The keyword helping to understand the approximate algorithm presented here is the sketch. Simply speaking a sketch is the summarization of a larger dataset. So as in the case of HyperLogLog explained previously in the blog, it lets us to represent a large number of elements in a smaller space. This smaller space is a 2-dimensional vector storing the number of occurred events in each cell.
But how the events are correlated with the cells ? The correlation is guaranteed by the pairwise independent hash functions. The first 2 words are in bold not by mistake. Without entering into scientific details, this family of hash functions helps to reduce the number of collisions between hash functions. More formally speaking, any function randomly chosen from the family should uniformly distribute 2 different random variables.
The "counting" step of the algorithm is presented in the following picture:
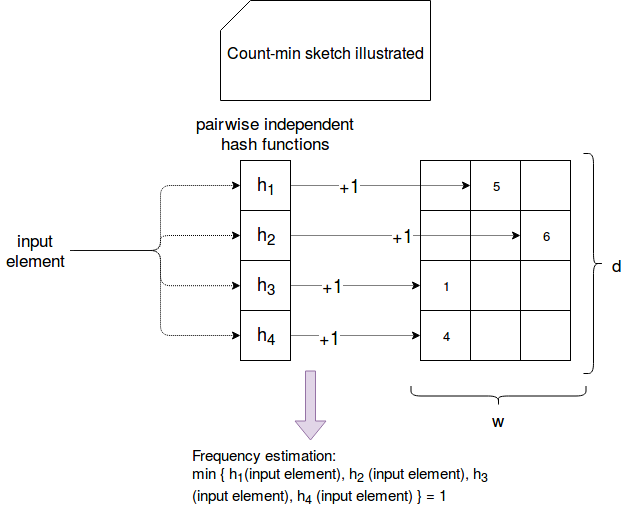
As you can clearly see in the picture, an input element is sent to each of hash functions. They compute the hash value corresponding to the index in the vector's row. The value stored in the matched cell is incremented by 1. Finally, to see the estimated number of occurrences, the minimal value among all matching cells is taken. Why min value is used ? It's because of the potential collisions. Even though the functions are pairwise independent, the risk of collisions still exists. So automatically some of cells can count more occurrences than they should. Hence taking the min value is the closest approximation. It's also important to emphasize that this computation method is used to answer the point query. Two remaining queries are computed with different methods:
- inner product query - the used formula for 2 Count-min sketches denoted as a and b is: min (CMSa[j] * CMSb [j]) where j is the index generated by each of hashing functions. The assumption here is that the same hashing functions are used for the same rows in two different sketches. The min is also taken to avoid the value with high number of collisions.
- range query - here the formula could be the sum of a frequency between the ranges i and j such as ai + ai+1 + .... + aj-1 + aj. However as the range grows, the error also grows linearly. A much more accurate formula exists and it uses a class interval called dyadic ranges . In a big picture, the algorithm is composed of the steps translated from quoted Jannik Sundermeier's example "The Count-Min-Sketch and its Applications":
- Define x Count-min sketches where x corresponds to the height dyadic tree (log(n) + 1 sketches). All sketches share the same hash functions and width/height parameters.
- Execute updates on each of sketches for (i, c). For each level find the range containing i. Let's call this range D[x, y]. Consider x as a key of the hash function and execute the update for (x, c) at each level. The update is the operation incrementing the cell retrieved from the hash by the value of c at each level.
- When a specific range is requested, get the subranges corresponding to the minimum cardinality covering for the range (e.g. for [1, 5] it would be {[1, 4], [5, 5]}, for [2, 4] {[2, 2], [3, 4]} and so on)
- Execute point queries on the subranges and sum the result. First determine at which level is located each range and later execute the point query on the sketch belonging to this level. For instance, if [1, 3] belongs to the level 3, then the point query must be executed on the sketch with the index 3. After the results of the point queries are sum up and it gives the final estimate.
Update in range queries with dyadic ranges
Let's take the example from "The Count-Min-Sketch and its Applications" and make it a little bit more explicit:
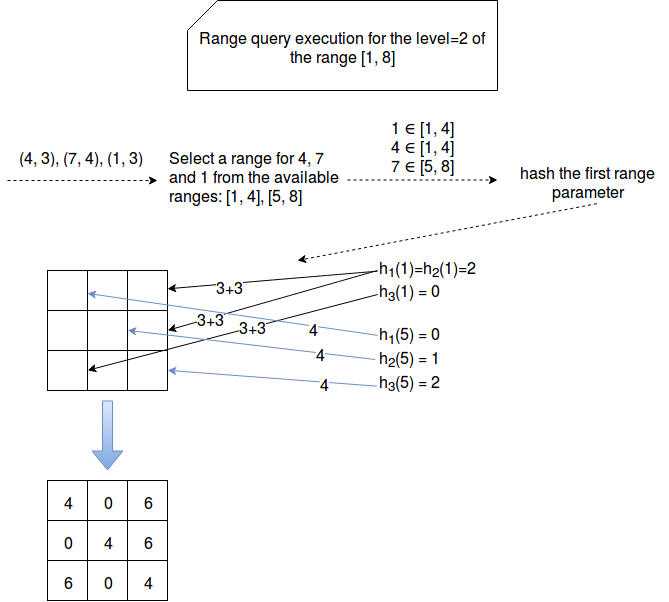
As you can see, we begin by finding the ranges matching the fist parameter of the input tuple. The range is D[x, y]. Later we hash the x by each of defined hash functions. At the end we increment the cells by the second paremeter of the tuple.
Dyadic ranges
A dyadic range has a form j2k...(j + 1)2k - 1 for the parameter j and k. Any arbitrary range [x, y] can be partitioned to at most 2 log n dyadic ranges.
Dyadic tree for n=8
The dyadic tree for range [1, 8] can be constructed as in the following image:
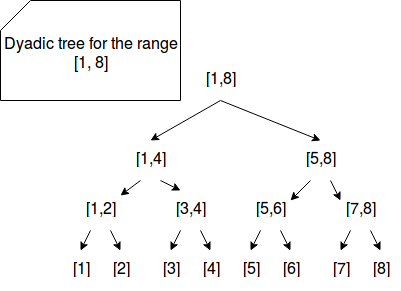
The height of such tree is 4, so in the case of range queries resolved with Count-min sketch we would create 4 different sketches.
At this stage you can also wonder how to choose the vector size (d - depth, w - width) ? As for HyperLogLog's registers, the Count-min sketch vector also has an important influence on the accuracy of the approximation. The width has an impact on the number of collisions while the depth on the approximation accuracy. Both can be computed with different formulas:
- w = e/ε - where e is Euler constant and ε the error factor. It determines the acceptable error rate.
- d = ln (1/δ) - the δ here corresponds to the estimation of error rate, that said 1 - δ gives the probability of computing correct results.
It's important to correctly define the ε and δ because both parameters define the accuracy requirements.
Count-min sketch example with Algerbird
As it was the case for HyperLogLog, we'll also use Algerbird library to show some of specificites of Count-min sketch. Below you can find some learning tests:
private val DefaultSeed = 1

private val DefaultHeavyHittersThreshold = 0.5

private val DefaultEpsilon = 0.001

private val DefaultDelta = 1E-10

private def generateDefaultCountMinSketch: TopPctCMSMonoid[Long] = TopPctCMS.monoid[Long](DefaultEpsilon,
  DefaultDelta, DefaultSeed, DefaultHeavyHittersThreshold)

"heavy hitters" should "be correctly found" in {
  val countMinSketch = generateDefaultCountMinSketch

  val data = List.fill(50)(1L)  ++ List.fill(49)(2L)  ++ List(3L)

  val count = countMinSketch.create(data)

  val heavyHitters = count.heavyHitters
  heavyHitters should have size 1
  heavyHitters should contain only(1L)
}

"estimate" should "not be similar for frequent and less frequent items" in {
  val countMinSketch = generateDefaultCountMinSketch

  val data = List.fill(100)(1L)  ++ List.fill(98)(2L)  ++ List(3L, 3L) ++ (0L to 10000L).toList ++
    (0L to 10000L).toList ++ (0L to 10000L).toList  ++ (0L to 10000L).toList

  val count = countMinSketch.create(data)

  val frequencyFor1 = count.frequency(1L)
  // The fact that Algerbird uses the max value as the estimate can be misleading
  // It comes from the way of initializing new instance of Approximate class returned by frequency(...) method
  // in private com.twitter.algebird.CMSInstance#makeApprox method. Such constructed Approximate class have
  // the min argument equal to math.max(0L, est - (eps * totalCount).toLong) and max equal to estimated value
  frequencyFor1.estimate shouldEqual 104
  frequencyFor1.max shouldEqual 104
  frequencyFor1.min shouldEqual 64
  // But the estimation for 1000 is less accurate (8 instead of 4)
  val frequencyFor1000 = count.frequency(1000L)
  frequencyFor1000.estimate shouldEqual 8L
  frequencyFor1000.max shouldEqual 8L
  frequencyFor1000.min shouldEqual 0L
  // In the other side, the estimate for 3 is correct
  val frequencyFor3 = count.frequency(3L)
  frequencyFor3.estimate shouldEqual 6
  frequencyFor3.max shouldEqual 6
  frequencyFor3.min shouldEqual 0
}

"bigger epsilon" should "lead to inaccurate results" in {
  // The default epsilon is here 0.001; let's increase it a little to see what happens with
  // the approximation. Since Epsilon has an impact on acceptable error rate, by increasing it
  // we inform the CMS about the increased tolerance on the errors. It explains why the estimate change and
  // is far far away from the reality
  val countMinSketch = TopPctCMS.monoid[Long](0.004,
    DefaultDelta, DefaultSeed, DefaultHeavyHittersThreshold)

  val data = List.fill(100)(1L)  ++ List.fill(98)(2L)  ++ List(3L, 3L) ++ (0L to 10000L).toList ++
    (0L to 10000L).toList ++ (0L to 10000L).toList  ++ (0L to 10000L).toList

  val count = countMinSketch.create(data)

  val frequencyFor1 = count.frequency(1L)
  frequencyFor1.estimate shouldEqual 156
  frequencyFor1.max shouldEqual 156
  frequencyFor1.min shouldEqual 0
}

"bigger delta parameter" should "decrease the estimate accuracy" in {
  // Same as above, the delta parameter relaxes the accuracy requirements
  val countMinSketch = TopPctCMS.monoid[Long](DefaultEpsilon, 1E-4, DefaultSeed, DefaultHeavyHittersThreshold)

  val data = List.fill(100)(1L)  ++ List.fill(98)(2L)  ++ List(3L, 3L) ++ (0L to 10000L).toList ++
    (0L to 10000L).toList ++ (0L to 10000L).toList  ++ (0L to 10000L).toList

  val count = countMinSketch.create(data)

  // Bigger delta parameter increases the estimate error and reduces the accuracy
  val frequencyFor1 = count.frequency(1L)
  frequencyFor1.estimate shouldEqual 112
  frequencyFor1.max shouldEqual 112
  frequencyFor1.min shouldEqual 72
  val frequencyFor2 = count.frequency(2L)
  frequencyFor2.estimate shouldEqual 114
  frequencyFor2.max shouldEqual 114
  frequencyFor2.min shouldEqual 74
  val frequencyFor3 = count.frequency(3L)
  frequencyFor3.estimate shouldEqual 14
  frequencyFor3.max shouldEqual 14
  frequencyFor3.min shouldEqual 0
  val frequencyFor1000 = count.frequency(1000L)
  frequencyFor1000.estimate shouldEqual 8
  frequencyFor1000.max shouldEqual 8
  frequencyFor1000.min shouldEqual 0
}

"bigger delta" should "not influence accuracy for small datasets" in {
  // We use the same delta as in the test above. But as you cans see in the assertions,
  // the results are pretty accurate because of smaller dataset and less collisions
  val countMinSketch = TopPctCMS.monoid[Long](DefaultEpsilon, 1E-4, DefaultSeed, DefaultHeavyHittersThreshold)

  val data = List(0L, 1L, 2L, 3L, 1L, 1L, 2L)

  val count = countMinSketch.create(data)
  val frequencyFor0 = count.frequency(0L)
  frequencyFor0.estimate shouldEqual 1
  frequencyFor0.max shouldEqual 1
  frequencyFor0.min shouldEqual 1
  val frequencyFor1 = count.frequency(1L)
  frequencyFor1.estimate shouldEqual 3
  frequencyFor1.max shouldEqual 3
  frequencyFor1.min shouldEqual 3
  val frequencyFor2 = count.frequency(2L)
  frequencyFor2.estimate shouldEqual 2
  frequencyFor2.max shouldEqual 2
  frequencyFor2.min shouldEqual 2
  val frequencyFor3 = count.frequency(3L)
  frequencyFor3.estimate shouldEqual 1
  frequencyFor3.max shouldEqual 1
  frequencyFor3.min shouldEqual 1
}

"Count-min sketch" should "also answer to the inner product query" in {
  val countMinSketch1 = generateDefaultCountMinSketch
  val countMinSketch2 = generateDefaultCountMinSketch
  val data = List.fill(100)(1L)  ++ List.fill(98)(2L)
  val count1 = countMinSketch1.create(data)
  val count2 = countMinSketch2.create(data)

  val innerProductCount = count1.innerProduct(count2)

  // 100*100 + 98*98 = 19604 - the estimation is accurate
  innerProductCount.estimate shouldEqual 19604
}
The family of approximation algorithms has a lot of members. Count-min sketch presented in this post is one of them. As we could learn in the first section, it can be used in Big Data applications, for instance to discover the number of items occured given number of items. The algorithm also helps to estimate size joins or ranges. The second part shown how the Count-min sketch works. The input element is first hashed by x hash functions from pairwise independent family. Each hashed value corresponds to a cell in the vector. At every match, the number stored in given cell is incremented by 1. At the end, the min value from all cells is considered as the estimation. The third section summarized that with the help of Algerbird library and some learning tests.