
One of important points for long-living queries is the tracking. It's always important to know how the query performs. In Structured Streaming we can follow this execution thanks to special object called ProgressReporter.
What would it take for you to trust your Databricks pipelines in production?
A 3-day bug hunt on a 3-person team costs up to €7,200 in lost engineering time. This workshop teaches you to prevent that — unit tests, data tests, and integration tests for PySpark and Databricks Lakeflow, including Spark Declarative Pipelines.

Konieczny
In this post we'll focus on the metrics gathered by the ProgressReporter object. In the first section we'll explain its lifecycle as well as some of implementation details. The next part will cover the exposed information while the last one will show the behavior of ProgressReporter through some tests.
ProgressReporter
First of all, let's define this famous ProgressReporter. It's a trait located in org.apache.spark.sql.execution.streaming and inherited directly by StreamExecution abstract class and thus indirectly by its implementations: org.apache.spark.sql.execution.streaming.continuous.ContinuousExecution and org.apache.spark.sql.execution.streaming.MicroBatchExecution. The role of ProgressReporter is to provide an interface that, once implemented, can be freely used to report the statistics about the execution of the streaming query.
The ProgressReporter defines a strict lifecycle phases:
- Everything begins when the streaming query trigger (processing or event time) is executed. The first thing the trigger does is the call to startTrigger method of ProgressReporter. This method prepares the reporter to accumulate the statistics for the just started execution.
- Later, depending on chosen streaming mode (micro-batch or continuous), the reporter registers the statistics about the execution of several different steps. These steps will be covered more in details in the next section. To do that, it uses the method reportTimeTaken[T](triggerDetailKey: String)(body: => T) that adds the metrics about the execution of these steps to currentDurationsMs: mutable.HashMap[String, Long] field.
- Next step is the data processing where also some statistics are gathered by the reporter.
- After adding these statistics to the currentDurationMs map, in the case of micro-batch execution, the ProgressReporter calls finishTrigger(hasNewData: Boolean). This method finalizes the trigger execution and creates the objects holding the execution statistics that are put to the progressBuffer = new mutable.Queue[StreamingQueryProgress](). Later the client can retrieve the updates (or the last one) directly from there, through the public accessor methods
In ProgressReporter we can also find some other metrics, as:
- newData - it's a Map[BaseStreamingSource, LogicalPlan] holding the most recent data per source
- availableOffsets - it's a map-like StreamProgress object storing the offsets available for the processing that aren't committed to the sink.
- committedOffsets - similar to availableOffset. The difference is that it stores the offsets for processed and committed data.
- currentBatchId - the id of currently processed batch
- currentStatus - the instance of org.apache.spark.sql.streaming.StreamingQueryStatus exposing the current status of the query. It exposes the information as data availability or trigger activity flags.
- watermarkMsMap - it's not present in ProgressReporter trait but it merits to be mentioned since it's used by StreamExecution. This field is a map (MutableMap[Int, Long]) where the key represents the operator from the physical plan and the value is a new watermark in milliseconds. This map is used at the end to update the global watermark:
if(!watermarkMsMap.isEmpty) { val newWatermarkMs = watermarkMsMap.minBy(_._2)._2 if (newWatermarkMs > batchWatermarkMs) { logInfo(s"Updating eventTime watermark to: $newWatermarkMs ms") batchWatermarkMs = newWatermarkMs } else { logDebug( s"Event time didn't move: $newWatermarkMs < " + s"$batchWatermarkMs") } } - stateOperators - are exposed through ExecutionStats case class from ProgressReporter. They contain the well known metrics discovered during metric testing: number of processed rows (numRowsTotal), number of updates rows (numRowsUpdated) and the memory used during stateful operations (memoryUsedBytes).
Measured metrics
In this part let's focus on the metrics that are measured with the reportTimeTaken[T](triggerDetailKey: String)(body: => T): T:
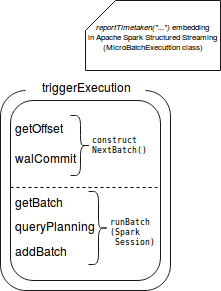
- triggerExecution - it reports how long the execution of given trigger, i.e. offsets retrieval, data processing and WAL commit took
- queryPlanning - here the execution plan is generated
- getBatch - retrieves new data from available source (micro-batch only). It's not about the physical data retrieval. At this stage, only the metadata about the next micro-batch like offsets, is retrieved.
- getOffset - measures the time used to retrieve offsets for new data to process for each of defined sources
- walCommit - measures the time taken to commit the new available offsets
- addBatch - returns the time taken to send the data to given sink
- runContunous - it measures the time taken to execute the streaming query in continuous processing mode
Some of the metrics include other ones. The following image shows this embedding:
ProgressReporter tests
Let's now investiage ProgressReporter and some of other previously mentioned properties through learning tests:
private val sparkSession: SparkSession = SparkSession.builder().appName("Spark Structured Streaming progress reporter")
    .master("local[2]").getOrCreate()
import sparkSession.sqlContext.implicits._

"sample count aggregation per id" should "have corresponding metricss" in {
  val inputStream = new MemoryStream[(Long, String)](1, sparkSession.sqlContext)
  val aggregatedStream = inputStream.toDS().toDF("id", "name")
    .groupBy("id")
    .agg(count("*"))

  val query = aggregatedStream.writeStream.trigger(Trigger.ProcessingTime(1000)).outputMode("complete")
    .foreach(new NoopForeachWriter())
    .start()

  val progress = new scala.collection.mutable.ListBuffer[StreamingQueryProgress]()
  new Thread(new Runnable() {
    override def run(): Unit = {
      var currentBatchId = -1L
      while (query.isActive) {
        inputStream.addData((1, "A"), (2, "B"))
        Thread.sleep(1000)
        val lastProgress = query.lastProgress
        if (currentBatchId != lastProgress.batchId) {
          progress.append(lastProgress)
          currentBatchId = lastProgress.batchId
        }
      }
    }
  }).start()

  query.awaitTermination(25000)
  val firstProgress = progress(0)
  firstProgress.batchId shouldEqual(0L)
  firstProgress.stateOperators should have size 0
  firstProgress.numInputRows shouldEqual(0L)
  val secondProgress = progress(1)
  secondProgress.batchId shouldEqual(1L)
  // Below some metrics contained in the progress reported
  // It's impossible to provide exact numbers it's why the assertions are approximate
  secondProgress.durationMs.get("addBatch").toLong should be > 6000L
  secondProgress.durationMs.get("getBatch").toLong should be < 1000L
  secondProgress.durationMs.get("queryPlanning").toLong should be < 1000L
  secondProgress.durationMs.get("triggerExecution").toLong should be < 11000L
  secondProgress.durationMs.get("walCommit").toLong should be < 500L
  secondProgress.stateOperators(0).numRowsTotal should be < 10L
  secondProgress.stateOperators(0).numRowsTotal should be > 0L
  secondProgress.stateOperators(0).numRowsTotal shouldEqual(secondProgress.stateOperators(0).numRowsUpdated)
  secondProgress.stateOperators(0).memoryUsedBytes should be > 10000L
  secondProgress.sources should have size 1
  secondProgress.sources(0).startOffset shouldEqual("0")
  secondProgress.sources(0).numInputRows should be >= 200L
  secondProgress.sink.description shouldEqual("ForeachSink")
}
Following data processing job progress, especially in the case of streaming pipelines, is an important task. Sooner any problems detected, sooner they'll be fixed and probably with less overhead. Apache Spark Structured Streaming provides an object very helpful in tracking the query performances. As shown in the first section, this object is ProgressReporter and it's included in the trigger activity. It exposes not only a quite common metrics as number of processed rows but also more complex ones, as the estimated used memory in stateful aggregations, number of updated rows or even the time taken to plan the query or retrieve new offsets to process.
Data Engineering Design Patterns

Looking for a book that defines and solves most common data engineering problems? I wrote
one on that topic! You can read it online
on the O'Reilly platform,
or get a print copy on Amazon.
I also help solve your data engineering problems contact@waitingforcode.com 📩
Related blog posts:
- Spark Declarative Pipelines internals
- Spark Declarative Pipelines, going further
- Spark Declarative Pipelines 101
#ApacheSparkStructuredStreaming monitoring object (ProgressReporter) explained in today's post: https://t.co/UiH6o101k7
— bardev (@waitingforcode) April 8, 2018