
Java Mission Control (JMC) described in previous post comes with another tool helping to understand what happens in the JVM. This tool is the Java Flight Recorder (JFR).
Data Engineering Design Patterns

Looking for a book that defines and solves most common data engineering problems? I wrote
one on that topic! You can read it online
on the O'Reilly platform,
or get a print copy on Amazon.
I also help solve your data engineering problems 👉 contact@waitingforcode.com 📩
The goal of this post is to show some simple uses of Java Flight Recorder. The first part presents it in a global image. The next section is about the configuration and the 3 different options of use. The last part shows how these 3 options can be used in the context of really running application.
Java Flight Recorder definition
A very clear metaphor for the Java Flight Recorder is the one of airplane's black box. This flight recorder accumulates the events observed during the fly. The role of JFR is the same. It accumulates events produced by the JVM on runtime.
According to the Oracle Java guide, the performance impact on the application is less than 2%. This small impact can be explained by the fact that accumulated data is stored in off-heap buffers. The fresh metrics are sent to thread-local off-heap buffers. Once these buffers are fullfilled, the accumulated data is moved to the global buffers. When these buffers are fullfilled in their turn, the data is finally flushed to disk. The disk flush can be disabled. With this configuration the JFR behaves as a circular buffer.
Circular buffer
A data structure known also as: circular queue, cyclic buffer or ring buffer. It uses a single and fixed-size buffer. When the buffer is full, each new added elements overrides the oldest element in the buffer.
The information collected by the JFR is called event. An event has: name, timestamp and optional payload having data describing what happened (e.g. heap size before and after the event). Among registered events we can distinguish for instance: threads waiting for locks, GC activity, CPU usage, I/O, servlet requests metrics or JDBC stats. More globally, the JFR records 3 types of events, all occurring at specific point of time:
- instant - occurs instantly, only once.
- requestable (aka sample) - is logged in regular interval of time that can be configured.
- duration - it's a continuous event since it takes some time to occur. They have a start and an end time.
Java Flight Recorder configuration
The events are recorded only if -XX:+UnlockCommercialFeatures -XX:+FlightRecorder are specified. The JFR can be used in one of 3 manners:
- from JMC - the recording can be started from the JMC's UI. In this solution we must right click on the application and select the option "Start Flight Recording". After clicking on it, the window below will appear:

After starting, the recording can be dumped at any moment by collapsing "Flight Recorded" item from application's menu and right-clicking on dump option. The result should be similar to the image below: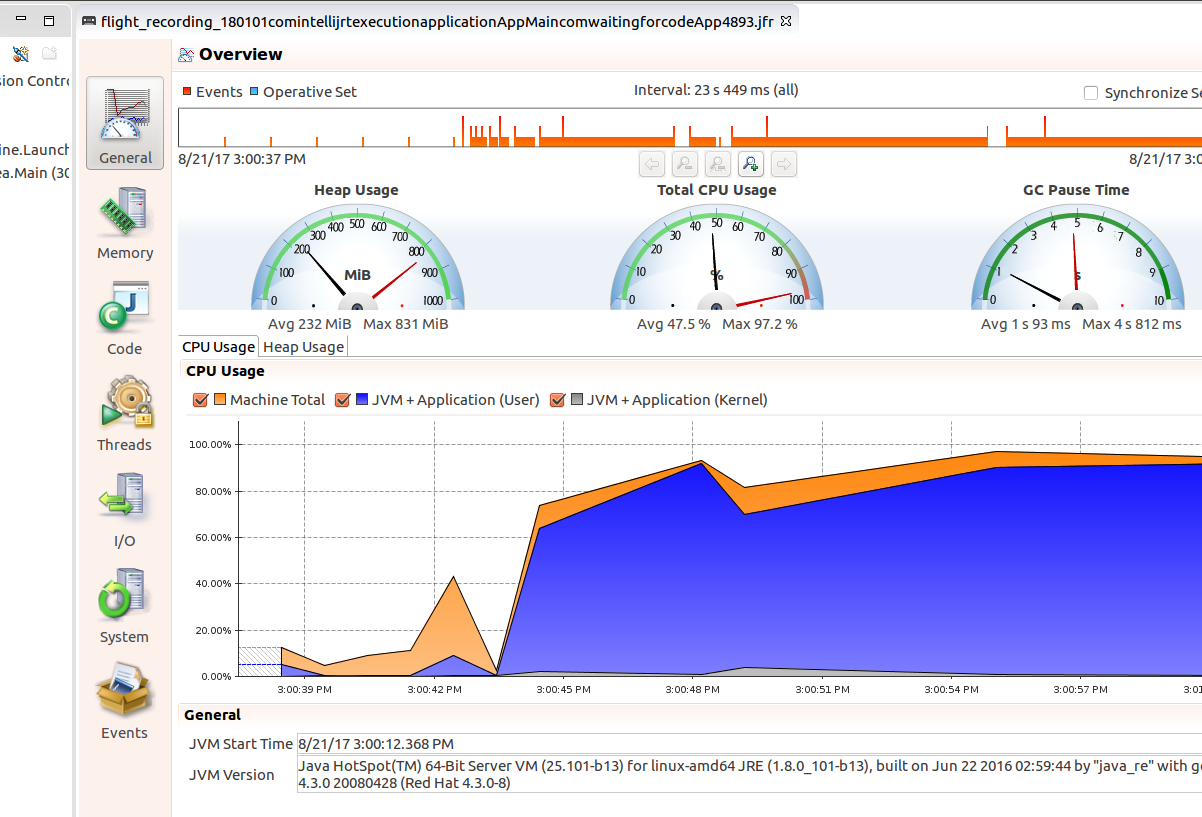
- from command line - in addition to previously defined JVM arguments we need to add the -XX:StartFlightRecording option. It takes several properties, as:
- compress - boolean flag indicating if the file with recorded information must be compressed
- defaultrecording - also boolean value but telling if the recording is continuous (= true, "continuous recording" is also called "default recording") or only a determined period of time (= false).
- delay - specifies the time before starting the recording
- duration - defines how long the events will be recorded, e.g. 60s can be used to represent 1-minute recording. Other available configurations are: m (minutes), h (hours) and d (days).
- filename - the file that will contain recorded information
- maxage - defines how long the recorded events will be stored on disk. The data older than this value will be discarded by the JFR. It can be explained in the same values as the duration.
- maxsize - configures the maximum size of buffers
- settings - indicates the configuration file
- from diagnostic command - the JFR can also be used with one of following jcmd commands:
- JFR.start - starts the recording
- JFR.stop - stops the recording
- JFR.check - checks the status of all recordings belonging to one JVM process. The process is specified as a parameter
- JFR.dump - makes a dump of data collected up to dump moment
How the registered data can be read ? As you can already deduce, the simplest and the most readable manner uses JMC UI. Dumped files can be read directly from File > Open File... part. It gives exactly the same output as the screens attached to the point about JMC in above list.
Java Flight Recorder example
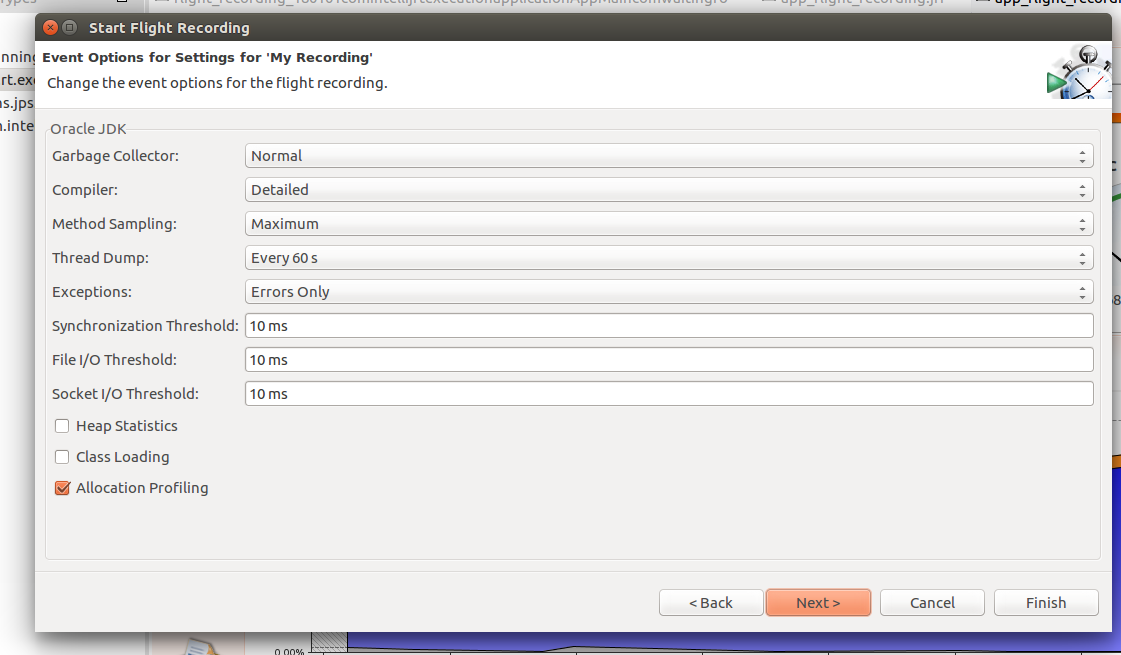
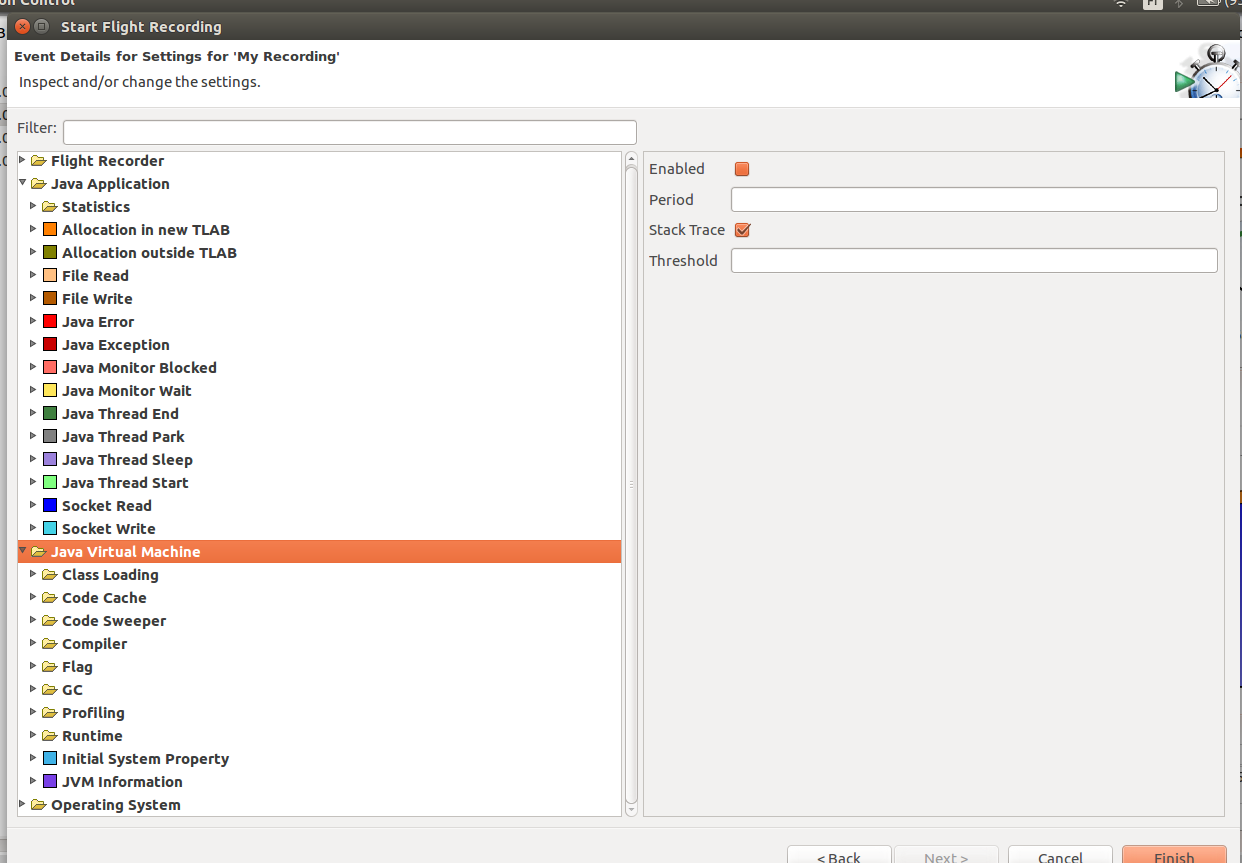
To test the JFR we'll use the same code as for the Java Missiong Control example. The use of JFR from JMC UI is straightforward. As told in the previous section, we must right click on the observed application and select the option "Start Flight Recording". 2 configuration windows can appear if "Next" button is clicked instead of "Finish":
The recording is physically started after the clicking on "Finish" button.
The configuration is much simpler in the case of command line options defined at application's start. In our case we'll use the following flags: -XX:+UnlockCommercialFeatures -XX:+FlightRecorder -XX:StartFlightRecording=duration=1d,filename=/tmp/app_flight_recording.dump. After starting the application, the logging indicating successful registering should be shown:
Started recording 1. The result will be written to:

/tmp/app_flight_recording.jfr
After the application stop, all events registered within 1 day are saved to /tmp/app_flight_recording.jfr file. And they can be simply read from JMC.
Similar configuration is used when starting the JFR from jcmd tool. The first step consists on finding the PID of profiled application by executing the jcmd command. It prints the list of all executed processes:
bartosz:/tmp$ jcmd
6455 com.intellij.rt.execution.application.AppMain com.waitingforcode.App
6491 sun.tools.jcmd.JCmd
3086 com.intellij.idea.Main
Our monitored application has the PID of 6455. The recording can be started with the following command:
bartosz:/tmp$ jcmd 6455 JFR.start duration=1d filename=/tmp/app_flight_recording_from_jcmd.jfr
6455:
It gives the same output as in the case of command line:
Started recording 2. The result will be written to:

/tmp/app_flight_recording_from_jcmd.jfr
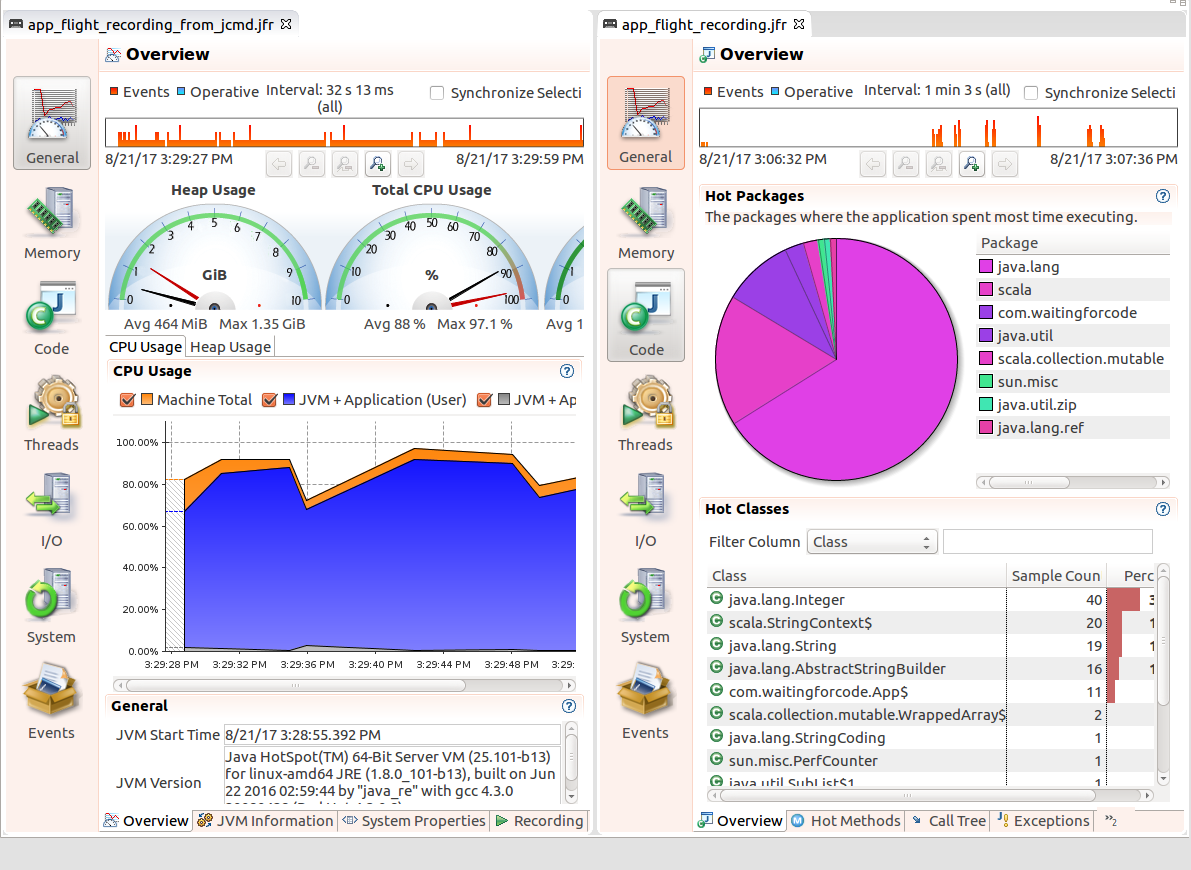
Both dump files registered with command line and jcmd can be opened from JMC. It gives the results shown in the following screens:
This post described the use of Java Flight Recorded in JVM-based applications monitoring. The JFR looks very much like airplane's black box that captures all events during the fly. JFR behaves equally because it records everything that happens on runtime. This "everything" can of course be configured, exactly as other properties such as: recording duration, dump file. The JFR can be started in 3 different manners: from JMC UI, from command line and with the help of jcmd tool. All of them allow to read the recorded events from the JMC UI.
Consulting
With nearly 16 years of experience, including 8 as data engineer, I offer expert consulting to design and optimize scalable data solutions.
As an O’Reilly author, Data+AI Summit speaker, and blogger, I bring cutting-edge insights to modernize infrastructure, build robust pipelines, and
drive data-driven decision-making. Let's transform your data challenges into opportunities—reach out to elevate your data engineering game today!
👉 contact@waitingforcode.com
🔗 past projects