
One of big changes in Java 8 regarding to Java 7 was the replacement of permanent generation by metaspace. Even if this change dates from more than year ago, it's worth to dedicate some lines about this new element in memory.
What would it take for you to trust your Databricks pipelines in production?
A 3-day bug hunt on a 3-person team costs up to €7,200 in lost engineering time. This workshop teaches you to prevent that — unit tests, data tests, and integration tests for PySpark and Databricks Lakeflow, including Spark Declarative Pipelines.

Konieczny
We'll start this article by reminding some information about permanent generation. Principally, we'll list its drawbacks to understand better the reasons of replacing it by metaspace in Java 8. The second part will describe more this new space in the memory. The last part will be about different ways to analyze what happens in metaspace.
Permanent generation drawbacks
Permanent generation is a pool containing data needed by JVM, such as classes or methods. This data is helpful when JVM wants to create new instance of given class. Normally, taken space by it is not so big. However, some features as hot deployment, may provoke errors caused by not enough space available in permanent generation to create new objects. One of the most commonly seen errors of this family is java.lang.OutOfMemoryError: PermGen space.
Permanent generation has some drawbacks - even if it's necessary to create new object instances. One of the most important is its static character. The size of permanent generation is specified at startup with -XX:MaxPermSize=xM argument. In additionally, this value is static and is not readjusted to changing runtime situation. Because of these limitations, it was replaced by metaspace in Java 8.
Metaspace in Java 8
Metaspace takes the responsibility of permanent generation to handle data associated to object's classes. So potential problems with not enough space to add new class descriptions still exist. They're only a little bit reduced because of some changes introduced to metaspace. To resume them, this list should be useful:
- size - the max size of metaspace can be fixed with the argument -XX:MaxMetaspaceSize, exactly as permanent generation was. However, if this argument is missing, default size of metaspace is limited to native memory available on the server. In additionally, the space taken by metaspace will be re-calculated dynamically, depending on application demand at runtime. In other words, when more and more classes will be loaded by class loaders, the memory reserved by metaspace will increase (or decrease when some classes data is garbage collected).
- garbage collecting - garbage collector on metaspace starts to work once metaspace's limit reaches. This limit can be specified with JVM's argument -XX:MetaspaceSize This way of doing can be helpful to tune metaspace size. For example, when garbage collector's activity on this space is too important, it can mean that metaspace specified size is inadequate to real situation or that some memory leaks approach.
- no klasses - metaspace doesn't hold anymore the object called KlassKlass and its derivatives. In permanent generation these objects were used to describe classes describing initially stored classes. It means that only information about original classes are stored. To discover what Klass and KlassKlass are, you can imagine following object chain for class called Pupil:
- new Pupil().getClass() refers to Klass objects and is of Class<Pupil> type
- new Pupil()).getClass().getClass() refers to KlassKlass object and is of Class<Class> type
As we could see, two arguments allow the modifications of metaspace size. But there are two another arguments which can be useful to tune this memory area: -XX:MinMetaspaceFreeRatio and -XX:MaxMetaspaceFreeRatio. They help to define when (earlier or later) collection should occur. On deallocating class metadata we use a term called high-water mark. When the level defined to it is reached, collection occurs. After this high-water mark value can be raised or lowered. Initially it's equal to -XX:MetaspaceSize argument presented earlier. After JVM analyzes the ratio of available allocated memory for class metadata to all allocated space for the same thing. If this ratio's percentage is bigger than MaxMetaspaceFreeRatio or lower than MinMetaspaceFreeRatio, high-water mark value will be lowered or raised. In this way garbage collection will occur more or less often.
Analyze metaspace
After some introduction paragraphs about metaspace, it's the time to play with it. We'll write a code which, after some time, will produce memory errors related to not enough free space available on metaspace. At the same time we'll observe, through VisualVM, how the use of metaspace evolves. To produce metaspace memory errors we use Javassist library and its feature to create classes at runtime. We start our test with following values for metaspace: 128M for initial metaspace size and 130M for maximal metaspace size. In additionally, we enable the following of garbage collector work with -XX:+PrintGCDetails. The class used to test metaspace is:
public class MemoryLeakTest {

    public static void main(String[] args) throws CannotCompileException, InterruptedException {
        System.out.println("Starting...");
        ClassPool cp = ClassPool.getDefault();
        for (int i = 0; i < 1_500_000; i++) {
            if (i%50000 == 0) {
                System.out.println(">> Sleeping for "+i);
                Thread.sleep(2000);
            }
            String className = "com.waitingforcode.metaspace.MemoryTroubler" + i;
            cp.makeClass(className).toClass();
        }
    }
}
After some seconds, we'll have the privilege to see following error message:
Exception in thread "main" java.lang.OutOfMemoryError: Metaspace
	at javassist.ClassPool.toClass(ClassPool.java:1085)
	at javassist.ClassPool.toClass(ClassPool.java:1028)
	at javassist.ClassPool.toClass(ClassPool.java:986)
	at javassist.CtClass.toClass(CtClass.java:1079)
	at com.waitingforcode.metaspace.MemoryLeakTest.main(MemoryLeakTest.java:13)
As expected, 130M reserved to metaspace is not enough to keep metadata of 1 500 000 classes. By analyzing printed GC work, we can observe how metaspace size was changing:
[Full GC (Ergonomics) [PSYoungGen: 5104K->0K(70656K)] [ParOldGen: 71200K->73888K(147456K)] 76304K->73888K(218112K), [Metaspace: 25719K->25719K(1062912K)], 0,3691469 secs] [Times: user=1,09 sys=0,02, real=0,37 secs] [GC (Allocation Failure) [PSYoungGen: 65536K->5120K(70656K)] 139424K->114064K(218112K), 0,0521329 secs] [Times: user=0,13 sys=0,02, real=0,05 secs] >> Sleeping for 50000 [GC (Allocation Failure) [PSYoungGen: 70656K->39904K(129024K)] 179600K->153488K(276480K), 0,0393078 secs] [Times: user=0,11 sys=0,04, real=0,04 secs] [Full GC (Ergonomics) [PSYoungGen: 39904K->4566K(129024K)] [ParOldGen: 113584K->147348K(265728K)] 153488K->151914K(394752K), [Metaspace: 48867K->48867K(1073152K)], 0,5780123 secs] [Times: user=1,92 sys=0,02, real=0,58 secs] [GC (Allocation Failure) [PSYoungGen: 93654K->48128K(137216K)] 241002K->205396K(402944K), 0,0777957 secs] [Times: user=0,24 sys=0,04, real=0,08 secs] [GC (Allocation Failure) [PSYoungGen: 137216K->59872K(152576K)] 294484K->260068K(418304K), 0,0972155 secs] [Times: user=0,28 sys=0,07, real=0,10 secs] >> Sleeping for 100000 [GC (Allocation Failure) [PSYoungGen: 152544K->87008K(179712K)] 352740K->316164K(445440K), 0,0767430 secs] [Times: user=0,26 sys=0,02, real=0,08 secs] [Full GC (Ergonomics) [PSYoungGen: 87008K->47974K(179712K)] [ParOldGen: 229156K->265245K(425984K)] 316164K->313219K(605696K), [Metaspace: 96691K->96691K(1095680K)], 0,9707989 secs] [Times: user=2,89 sys=0,05, real=0,97 secs] [GC (Allocation Failure) [PSYoungGen: 140646K->81504K(219648K)] 405891K->372453K(645632K), 0,9317130 secs] [Times: user=2,04 sys=0,06, real=0,93 secs] [GC (Metadata GC Threshold) [PSYoungGen: 176041K->117760K(225280K)] 466990K->432765K(651264K), 0,1372545 secs] [Times: user=0,31 sys=0,01, real=0,14 secs] [Full GC (Metadata GC Threshold) [PSYoungGen: 117760K->6130K(225280K)] [ParOldGen: 315005K->425720K(626688K)] 432765K->431850K(851968K), [Metaspace: 131763K->131763K(1110016K)], 2,1981618 secs] [Times: user=6,65 sys=0,09, real=2,20 secs] [GC (Last ditch collection) [PSYoungGen: 6130K->0K(268800K)] 431850K->431968K(895488K), 0,0781865 secs] [Times: user=0,30 sys=0,00, real=0,08 secs] [Full GC (Last ditch collection) [PSYoungGen: 0K->0K(268800K)] [ParOldGen: 431968K->431793K(682496K)] 431968K->431793K(951296K), [Metaspace: 131763K->131763K(1110016K)], 1,3399263 secs] [Times: user=4,79 sys=0,05, real=1,34 secs] [GC (Metadata GC Threshold) [PSYoungGen: 2568K->96K(275968K)] 434362K->431889K(958464K), 0,0066006 secs] [Times: user=0,02 sys=0,00, real=0,01 secs] [Full GC (Metadata GC Threshold) [PSYoungGen: 96K->0K(275968K)] [ParOldGen: 431793K->431794K(752128K)] 431889K->431794K(1028096K), [Metaspace: 131763K->131763K(1110016K)], 1,0349512 secs] [Times: user=3,71 sys=0,04, real=1,03 secs] [GC (Last ditch collection) [PSYoungGen: 0K->0K(277504K)] 431794K->431794K(1029632K), 0,0071087 secs] [Times: user=0,02 sys=0,00, real=0,01 secs] [Full GC (Last ditch collection) [PSYoungGen: 0K->0K(277504K)] [ParOldGen: 431794K->431794K(825856K)] 431794K->431794K(1103360K), [Metaspace: 131763K->131763K(1110016K)], 1,3406952 secs] [Times: user=4,78 sys=0,05, real=1,34 secs] Heap PSYoungGen total 277504K, used 5506K [0x00000000d6900000, 0x00000000f0d00000, 0x0000000100000000) eden space 138240K, 3% used [0x00000000d6900000,0x00000000d6e60960,0x00000000df000000) from space 139264K, 0% used [0x00000000e8500000,0x00000000e8500000,0x00000000f0d00000) to space 145920K, 0% used [0x00000000df000000,0x00000000df000000,0x00000000e7e80000) ParOldGen total 825856K, used 431794K [0x0000000083a00000, 0x00000000b6080000, 0x00000000d6900000) object space 825856K, 52% used [0x0000000083a00000,0x000000009dfac810,0x00000000b6080000) Metaspace used 131793K, capacity 132962K, committed 133120K, reserved 1110016K class space used 72272K, capacity 72329K, committed 72448K, reserved 1048576Kmore information about output meaning can be found in the article about Reading verbosegc output
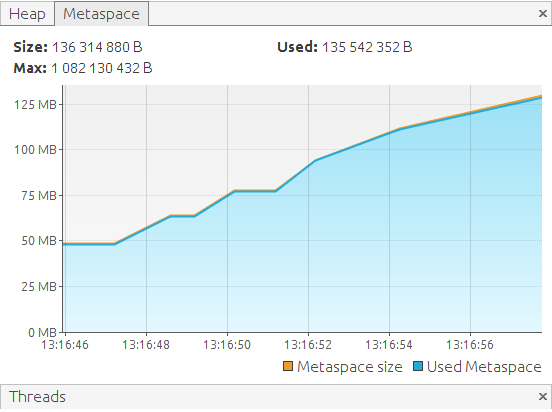
We can see that metaspace is growing with each newly created class. However, this growth is not accompanied by garbage collecting and finally we can observe java.lang.OutOfMemoryError: Metaspace error. It proves also that metaspace's size changes dynamically, until reaching limit defined in MaxMetaspaceSize argument. In the side of VisualVM, we can observe metaspace graph growing too:
This article introduces some basic aspects of metaspace, since Java 8 responsible for handling metadata (fields, methods) related to classes. Unlike permanent generation, this new space uses native memory and can grow dynamically at runtime. Nevertheless, this dynamic growing doesn't eliminate memory leaks caused by classloaders issues. We can even suppose that because of these changes, classloader problems will be detected later than in the case of fixed-sized permanent generation.
Data Engineering Design Patterns

Looking for a book that defines and solves most common data engineering problems? I wrote
one on that topic! You can read it online
on the O'Reilly platform,
or get a print copy on Amazon.
I also help solve your data engineering problems contact@waitingforcode.com 📩