
Historically JVisualVM was one of Oracle references to monitor the state of the JVM. However the 7th version of Java brought an alternative called Java Mission Control.
What would it take for you to trust your Databricks pipelines in production?
A 3-day bug hunt on a 3-person team costs up to €7,200 in lost engineering time. This workshop teaches you to prevent that — unit tests, data tests, and integration tests for PySpark and Databricks Lakeflow, including Spark Declarative Pipelines.

Konieczny
This post makes an insight on this profiling and monitoring tool. The first part shortly defines it. The second part shows, through taken screenshots, which information it exposes.
Java Mission Control defined
Java Mission Control (JMC) is a set of tools helping to analyze what happens in the JVM. It's composed of 3 parts:
- JMX console - monitors JVM activity in real-time and allows to change some of JVM's properties without restarting it. Moreover, it can be used as alerting system to send notifications when the threshold of some metrics is reached (e.g. CPU use is equal to 90%)
- Java Flight Recorder (JFR) - JFR collects data over time. It can be used separately from JMC but the most often both are used together. Please note that the JFR can be freely used only for evaluation purposes. Used in production servers it requires a commercial licence.
- external plugins - as in the case of JVisualVM, JMC also makes possible to extend its features with additional plugins
JMC collects low level runtime information (heap size, CPU use, number of objects of particular class...) and exposes it through an UI. It can work locally and remotely. For this second case, it's required to configure jmxremote (e.g.: -Dcom.sun.management.jmxremote=true -Dcom.sun.management.jmxremote.port=3614 -Dcom.sun.management.jmxremote.authenticate=false -Dcom.sun.management.jmxremote.ssl=false) when the monitored application is started. JMC interacts thus with JVM's JMX agent to discover what happens on the JVM.
Historically JMC was developped as a part of proprietary JVM called JRockit. Its initial goal was to provide a non intrusive monitoring and profiling tool for production applications running on JRockit. With the update 40th of Java 7 the JMC was moved to public JDK. JMC achieves good performances and is not intrusive because the collected events come directly from the JVM. Thanks to that it avoids the observer effect. JMC is different than other monitoring tools that use sampling or profiling techniques.
Observer effect
It occurs when the observation of a phenomenon changes the phenomenon itself. In IT we can meet observer effect when for instance:
- we want to analyze the CPU use with the program running on the same PC and so using the analyzed CPU
- logging the information about program execution that can slow down the whole execution time because of I/Os
Sampling and profiling in monitoring tools
We can monitor and analyze applications on runtime with either sampling or profiling approach.
Sampling consists on collecting runtime information every defined interval of time, for instance every 1 minute. As you can see, the collected information can be approximative. For example, if we have methods executed in less than 1 minute, their metrics can be missed by the sampler.
Profiling is more exact measure because it instrumentates the executed code. However it adds a bigger performance overhead than the sampling and can seriously slow down the application.
The JMC UI is launched through jmc command. We can customize some of its features, as define workspace (-data $workspace attribute) or add additional JVM arguments (-vmargs $jvmArguments attribute). The configuration can also be modified through the changes of jmc.ini file
Zoom at JMC
Now it's time to discover JMC in practice. The points below will list the main (subjectively chosen) tabs of JMC UI:
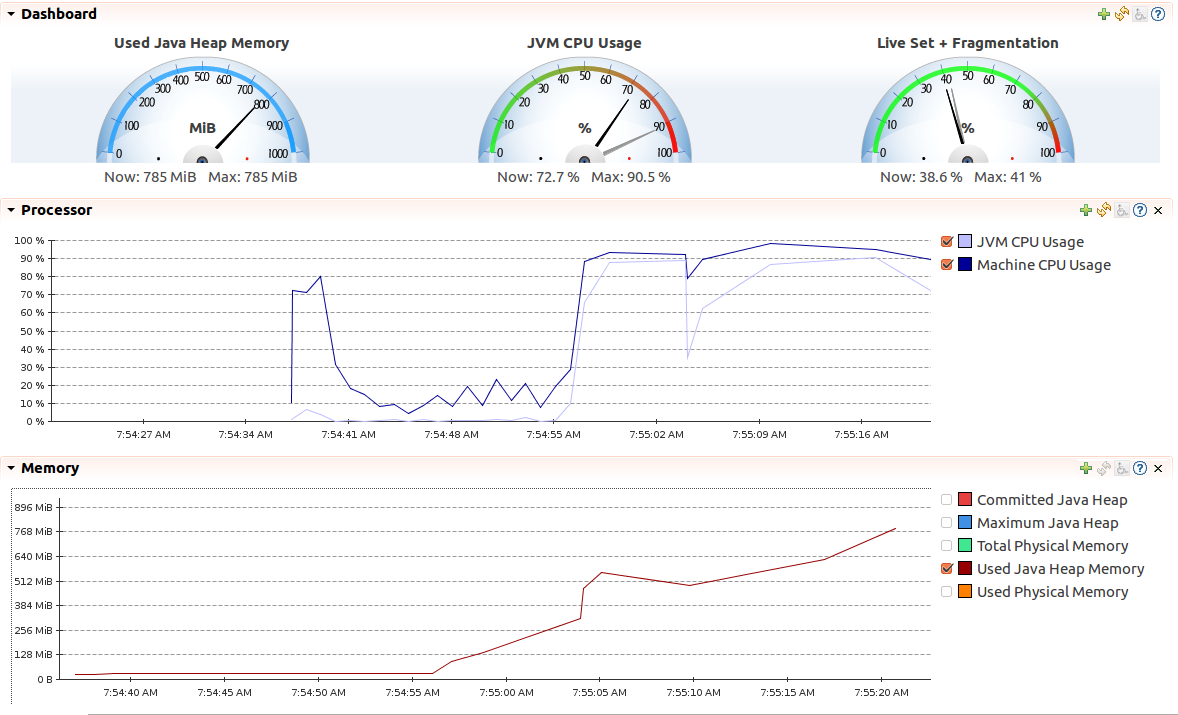
- Dashboard - globally this part looks similarly to the JVisualVM dashboards. We can find there heap and CPU use in 2 differnet representations (detailed and resumed). An interesting thing is that we can freely modify displayed parts by clicking at "+" button.
At first glance the third metric displayed by default, Live set and fragmentation, can be difficult to understand. In fact it represents the amount of free heap memory after each GC. If this value increases every time it means that the available heap is smaller after the subsequent GC that probably means the memory leaks.
- System - this tab groups all information about executed system. We can find there server properties, JVM stats and system properties.
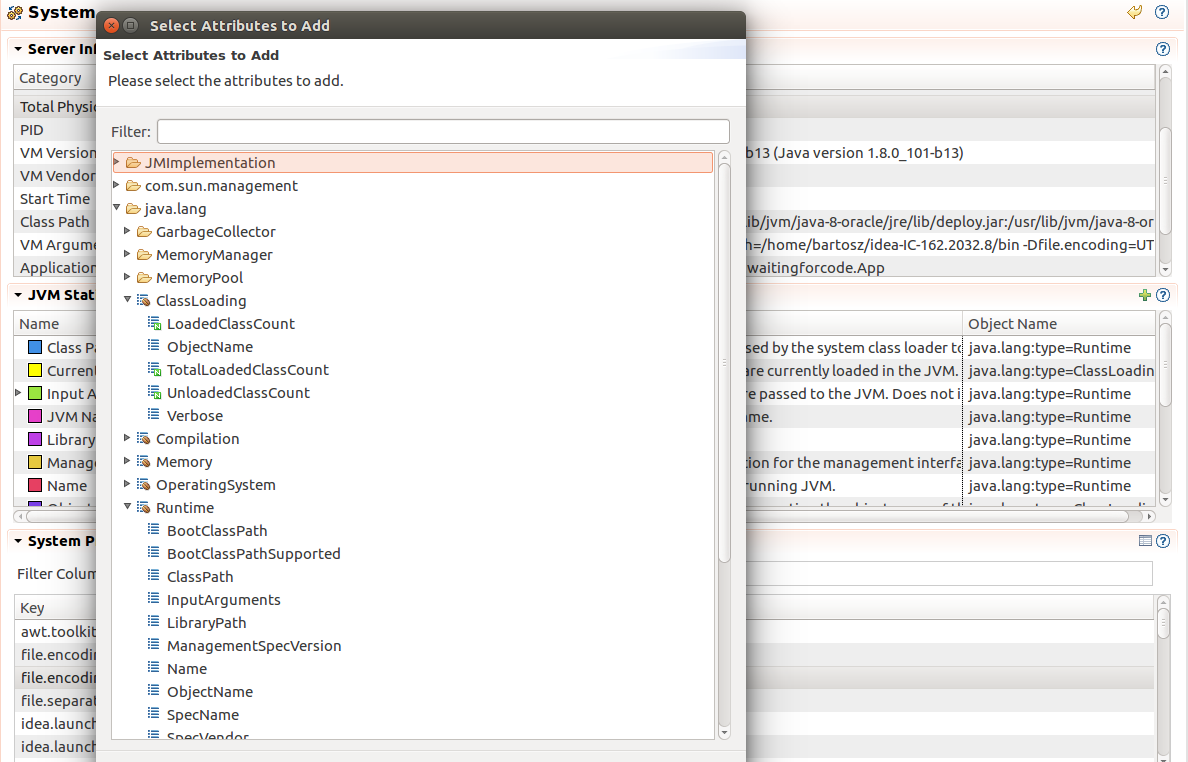
Here too we can freely compose exposed metrics. The second screen shows some of additional available JVM statistics we can add.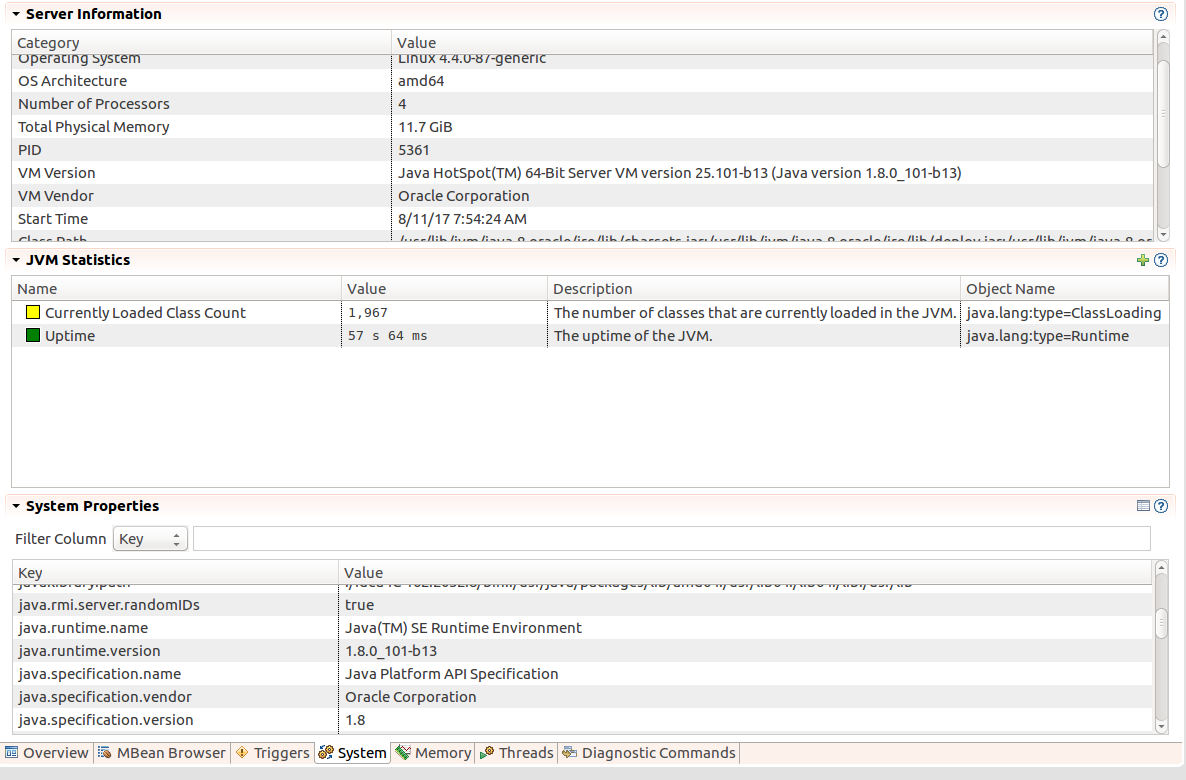
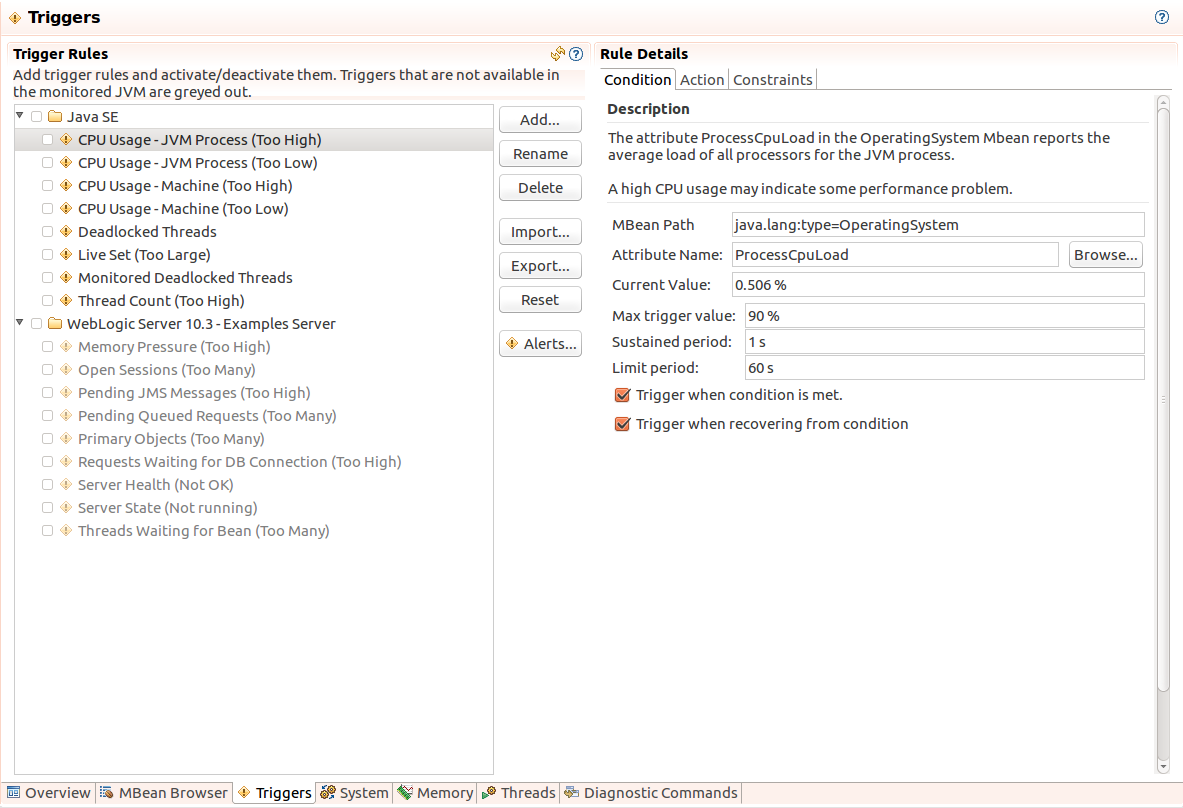
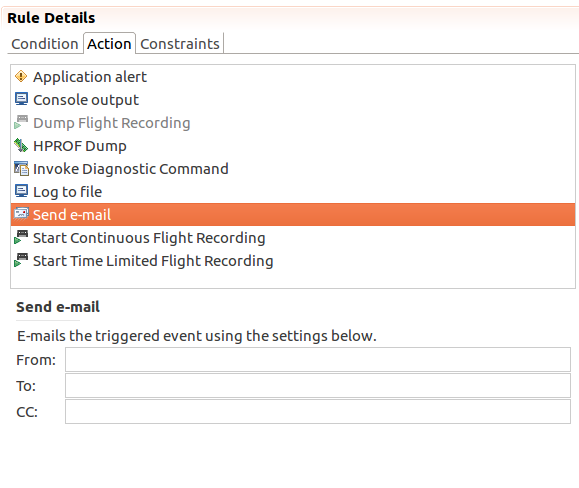
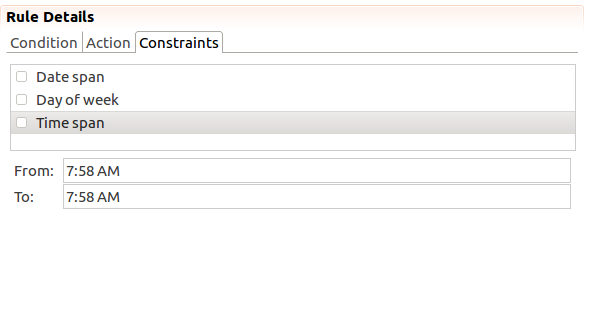
- Triggers - it's maybe the most interesting part, not present in JVisualVM. It enables the definition of alerts that are triggered after given metric reaches specified threshold. Similarly to previously described parts, triggers can also be freely configured. We can for instance define the days where the alert is active. We can also specify the actions triggered when the threshold is met, e.g. sending an e-mail or logging the alert to the file.
- Memory - this view is a classical one in the most of JVM monitoring tools. It groups all metrics related to the memory, as: the number of created instance for all classes living in the heap, GC stats or active memory pools.
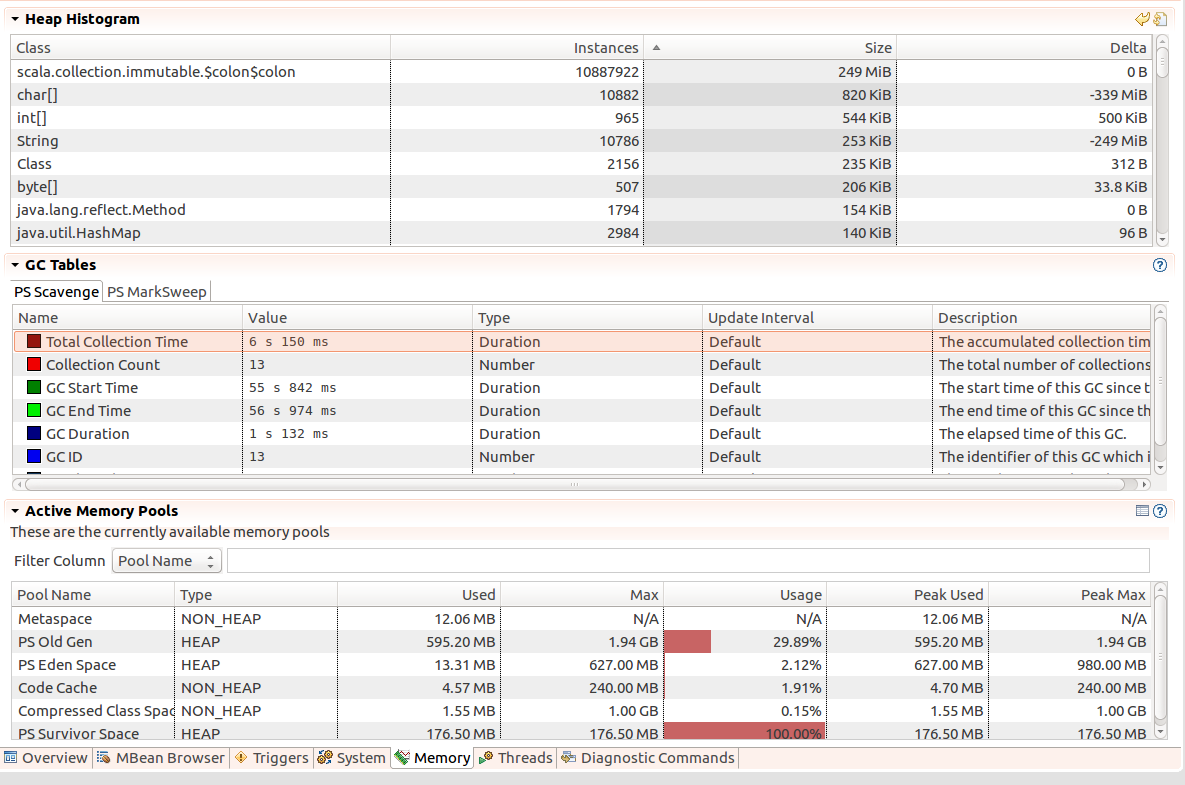
Memory pools
Generally memory pools represent the set of memory resources preallocated by the system enabling dynamic memory allocation (= memory allocated on runtime, e.g. by using C++ new operator). They can be grouped in hierarchical structures and enable the memory release for a set of objects with in just one operation.
In JVM memory pools are represented by on-heap and off-heap memory parts, as metaspace or generations (young, old).
JMC came to JDK some time ago but it still less popular than JVisualVM. But as we could see in the first part, the JMC enhances the features proposed by JVisualVM by limiting observer effect and working with Java Flight Recorder. Through the screens from the second section we could also see that the JMC proposes not only monitoring but also alerting (trigger) in different forms (e-mail, log...). This part also shown that the JMC is not a closed tool because it can be freely customized thanks to a lot of "+" buttons defined in the interface.
Data Engineering Design Patterns

Looking for a book that defines and solves most common data engineering problems? I wrote
one on that topic! You can read it online
on the O'Reilly platform,
or get a print copy on Amazon.
I also help solve your data engineering problems contact@waitingforcode.com 📩
Read also about Java Mission Control tool here:
- JMC JMC user guid Debug a Memory Leak Using Java Flight Recorder Dynamic Memory Allocation Working with JRockit Runtime Analyzer