
State store is a critical part of any stateful Structured Streaming application. It's important to know what happens when your business logic and input data interact with it. State store metrics will provide you some key insight into this interaction. If you don't know them now, no worries, it's the topic of this blog post!
What would it take for you to trust your Databricks pipelines in production?
A 3-day bug hunt on a 3-person team costs up to €7,200 in lost engineering time. This workshop teaches you to prevent that — unit tests, data tests, and integration tests for PySpark and Databricks Lakeflow, including Spark Declarative Pipelines.

Konieczny
ProgressReporter
If you analyze Structured Streaming logs, you will certainly notice the entries like:
[2021-02-28 12:41:00,488] org.apache.spark.internal.Logging DEBUG Execution stats: ExecutionStats(Map(),ArrayBuffer({
  "numRowsTotal" : 1,
  "numRowsUpdated" : 0,
  "memoryUsedBytes" : 1064,
  "customMetrics" : {
    "loadedMapCacheHitCount" : 8,
    "loadedMapCacheMissCount" : 0,
    "stateOnCurrentVersionSizeBytes" : 408
  }
}),Map(watermark -> 2020-05-04T22:55:00.000Z)) (org.apache.spark.sql.execution.streaming.MicroBatchExecution:61
They come from finishTrigger method called by runActivatedStream method of the MicroBatchExecution class:
  protected def runActivatedStream(sparkSessionForStream: SparkSession): Unit = {
    triggerExecutor.execute(() => {
// ...
        startTrigger()
// ...
        reportTimeTaken("triggerExecution") {
          // We'll do this initialization only once every start / restart
          if (currentBatchId < 0) {
            populateStartOffsets(sparkSessionForStream)
            logInfo(s"Stream started from $committedOffsets")
          }
// ...
          if (isCurrentBatchConstructed) {
            if (currentBatchHasNewData) updateStatusMessage("Processing new data")
            else updateStatusMessage("No new data but cleaning up state")
            runBatch(sparkSessionForStream)
          } else {
            updateStatusMessage("Waiting for data to arrive")
          }
        }

        // Must be outside reportTimeTaken so it is recorded
        finishTrigger(currentBatchHasNewData, isCurrentBatchConstructed)
Under-the-hood, the finishTrigger calls ProgressReporter's extractStateOperatorMetrics. This extract function gets state store metrics from the StateStoreWriter's getProgress() method.
Inside the getProgress method you will find calls to longMetric() and value, which are the keys to understand the metrics mechanism. The longMetric function returns an instance of SQLMetric class which is in fact an accumulator! I bet that thanks to it, you already know what the value call is doing. Indeed, it will merge the values accumulated on the executors to the driver:
// finishTrigger()
  private def extractStateOperatorMetrics(hasExecuted: Boolean): Seq[StateOperatorProgress] = {
    if (lastExecution == null) return Nil
    // lastExecution could belong to one of the previous triggers if `!hasExecuted`.
    // Walking the plan again should be inexpensive.
    lastExecution.executedPlan.collect {
      case p if p.isInstanceOf[StateStoreWriter] =>
        val progress = p.asInstanceOf[StateStoreWriter].getProgress()
        if (hasExecuted) progress else progress.copy(newNumRowsUpdated = 0)
    }
  }
// StateStoreWriter
  def getProgress(): StateOperatorProgress = {
    val customMetrics = stateStoreCustomMetrics
      .map(entry => entry._1 -> longMetric(entry._1).value)

    val javaConvertedCustomMetrics: java.util.HashMap[String, java.lang.Long] =
      new java.util.HashMap(customMetrics.mapValues(long2Long).asJava)

    new StateOperatorProgress(
      numRowsTotal = longMetric("numTotalStateRows").value,
      numRowsUpdated = longMetric("numUpdatedStateRows").value,
      memoryUsedBytes = longMetric("stateMemory").value,
      javaConvertedCustomMetrics
    )
  }
The metrics are initialized on the StateStoreWriter side exactly like any other accumulators; i.e, by calling the register method:
  def createSizeMetric(sc: SparkContext, name: String): SQLMetric = {
    val acc = new SQLMetric(SIZE_METRIC, -1)
    acc.register(sc, name = Some(name), countFailedValues = false)
    acc
  }
That's the first part of the mystery. But it doesn't explain who and how created these SQLMetrics.
Metrics update
Before going to the "who" question, let me explain "what" these state store metrics are. Among them you will find:
- numOutputRows - number of states returned to the downstream process
- numTotalStateRows - total number of keys in the state store, including the states not modified in the given micro batch
- numUpdatedStateRows - number of created or updated states from the processed input rows
- allUpdatesTimeMs - the time, in milliseconds, taken to create or update states from the processed input rows
- allRemovalsTimeMs - the time taken to remove too old states from the state store
- commitTimeMs -the time, in milliseconds, taken to commit the state store; in other words, how long it took to write the state store delta file to the checkpoint location for the default state store implementation; how long it took to execute StateStore commit() method in a more general way
- stateMemory - estimated memory size used by the state store, in bytes.
- custom state store metrics, specific to the used backend; I'll focus on this part in the next section
From my previous blog posts you already know that the state store is a partition-based instance. In other words, every Apache Spark task manages its own state store instance. Thus, it's also the same component which manages the state store metrics! If you take a look at the code, you will see that the physical nodes responsible for stateful operations, like StateStoreSaveExec or StreamingGlobalLimitExec, retrieves the state store metrics in every mapPartitionsWithStateStore execution. And inside, they increment the value of the local accumulator corresponding to each metric.Below you can find an example for the StateStoreSaveExec operation:
    child.execute().mapPartitionsWithStateStore(
// ...
      Some(sqlContext.streams.stateStoreCoordinator)) { (store, iter) =>
        val numOutputRows = longMetric("numOutputRows")
        val numUpdatedStateRows = longMetric("numUpdatedStateRows")
        val allUpdatesTimeMs = longMetric("allUpdatesTimeMs")
        val allRemovalsTimeMs = longMetric("allRemovalsTimeMs")
        val commitTimeMs = longMetric("commitTimeMs")
// ...
        outputMode match {
          // Update and output all rows in the StateStore.
          case Some(Complete) =>
            allUpdatesTimeMs += timeTakenMs {
              while (iter.hasNext) {
                val row = iter.next().asInstanceOf[UnsafeRow]
                stateManager.put(store, row)
                numUpdatedStateRows += 1
              }
            }
            allRemovalsTimeMs += 0
            commitTimeMs += timeTakenMs {
              stateManager.commit(store)
            }
            setStoreMetrics(store)
            stateManager.values(store).map { valueRow =>
              numOutputRows += 1
              valueRow
            }
Above, you can see the native metrics, but you can also extend them! In the next section, you will see how the custom metrics work for the default, HDFS-compatible, file system.
Custom metrics
Every implementation of the StateStoreProvider interface has a method called supportedCustomMetrics. It returns a sequence of StateStoreCustomMetric:
trait StateStoreCustomMetric {
  def name: String
  def desc: String
}

case class StateStoreCustomSumMetric(name: String, desc: String) extends StateStoreCustomMetric
case class StateStoreCustomSizeMetric(name: String, desc: String) extends StateStoreCustomMetric
case class StateStoreCustomTimingMetric(name: String, desc: String) extends StateStoreCustomMetric

trait StateStoreProvider {
  def supportedCustomMetrics: Seq[StateStoreCustomMetric] = Nil
}
If you take a look at the HDFSBackedStateStoreProvider, you will notice that it exposes 2 extra metrics. The first of them shows how many times the provider loaded the state store from the in-memory cached HashMap. The second extra metric shows the opposite; i.e, how often it had to build the cache from delta and snapshot files. Apart from them, the supportedCustomMetrics also returns the estimated size of the cached state store:
  def getMetricsForProvider(): Map[String, Long] = synchronized {
    Map("memoryUsedBytes" -> SizeEstimator.estimate(loadedMaps),
      metricLoadedMapCacheHit.name -> loadedMapCacheHitCount.sum(),
      metricLoadedMapCacheMiss.name -> loadedMapCacheMissCount.sum())
  }
The custom metrics join later with the state store built-in metrics presented in the previous section, and they are logged at getProgress() call:
trait StateStoreWriter extends StatefulOperator { self: SparkPlan =>

  override lazy val metrics = Map(
    "numOutputRows" -> SQLMetrics.createMetric(sparkContext, "number of output rows"),
    "numTotalStateRows" -> SQLMetrics.createMetric(sparkContext, "number of total state rows"),
    "numUpdatedStateRows" -> SQLMetrics.createMetric(sparkContext, "number of updated state rows"),
    "allUpdatesTimeMs" -> SQLMetrics.createTimingMetric(sparkContext, "time to update"),
    "allRemovalsTimeMs" -> SQLMetrics.createTimingMetric(sparkContext, "time to remove"),
    "commitTimeMs" -> SQLMetrics.createTimingMetric(sparkContext, "time to commit changes"),
    "stateMemory" -> SQLMetrics.createSizeMetric(sparkContext, "memory used by state")
  ) ++ stateStoreCustomMetrics
Just below you can find a visual summary of this article:
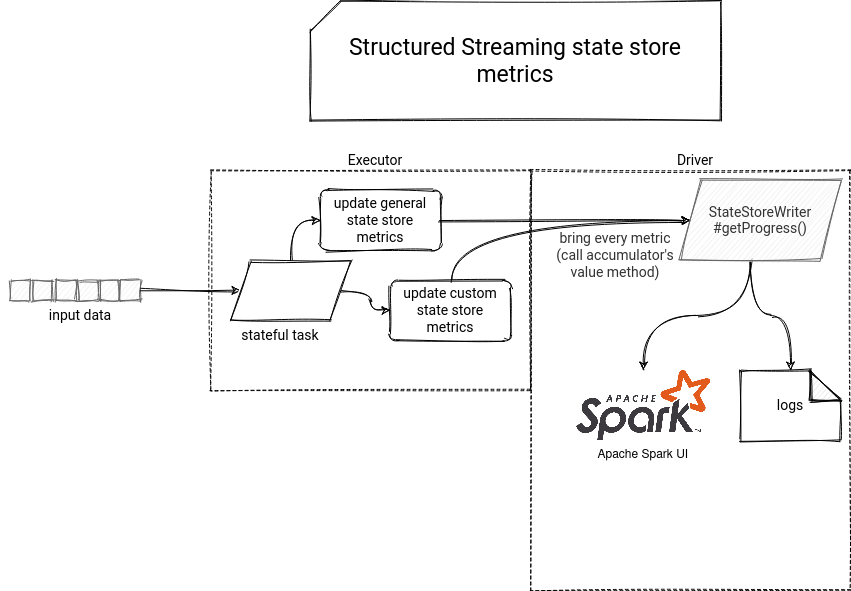
State store metrics are an important indicator for stateful streaming applications. They can help you to visualize the load of the state store, operations specificity (update, removal), and even get an estimated size taken by the state store on your executors so that you can eventually decide to use an alternative backend.
Data Engineering Design Patterns

Looking for a book that defines and solves most common data engineering problems? I wrote
one on that topic! You can read it online
on the O'Reilly platform,
or get a print copy on Amazon.
I also help solve your data engineering problems contact@waitingforcode.com 📩
Read also about State store metrics here:
Related blog posts:
- Spark Declarative Pipelines internals
- Spark Declarative Pipelines, going further
- Spark Declarative Pipelines 101
Curious about how state store metrics interact with stateful #StructuredStreaming code? It's the topic of the new blog post ? https://t.co/BcfYE5zE16
— Bartosz Konieczny (@waitingforcode) May 22, 2021