
In this blog I've covered the topics about relational databases, key-value stores, search engines or log systems. There are still some storage systems deserving some learning effort and one of them are graphs considered here in the context of data processing.
What would it take for you to trust your Databricks pipelines in production?
A 3-day bug hunt on a 3-person team costs up to €7,200 in lost engineering time. This workshop teaches you to prevent that — unit tests, data tests, and integration tests for PySpark and Databricks Lakeflow, including Spark Declarative Pipelines.

Konieczny
This post initializes new category devoted to graphs and their processing at scale. It starts by explaining some global concepts. Its first section recalls shortly graph data structures and its components. The second section focuses on the storage of graphs while the last one on their processing.
Graphs
Before talking about graphs in the context of data processing, it's important to recall some basic concepts about them:
- vertices and edges - graph is a data structure composed of vertices that may be linked between them by edges. Vertices and edges can have key-value attributes. They can be used for instance during traversal to process only expected items (filter).
- labels (types) - both vertices and edges can be "classified" with the labels that are a kind of attributes. Thus, a labeled graph is the graph which vertices and/or edges have labels associated with them.
- direction - graph can be directed or undirected. In the former ones the edges indicate the relationship direction (e.g. "is child of") while the latter consider joined vertices as equal (e.g. "is friend of" relationship). Undirected relationship is also known as symmetrical.
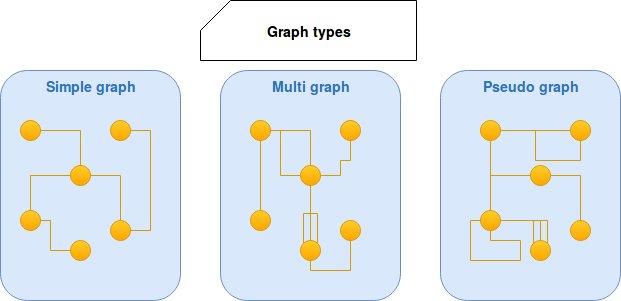
- graph types - we distinguish different graph types: pseudo graph, multi graph and simple graph. The first type is a graph where multiple edges between 2 vertices and a loops are allowed. In multi graph the loops are not allowed while in the simple graph only 1 edge between 2 given vertices is possible. The following image summarizes these 3 types:
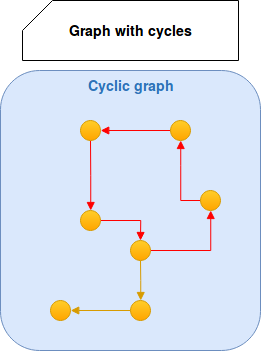
- cycles - a graph can have or have not the cycles. A cycle is a path of edges and vertices in which given vertex is reachable from itself. It requires a particular care during graph utilization because it can lead to infinite traversals. An example of cycle is marked in red:
- vertex degree - this name describes the number of incoming and outgoing edges of given vertex.
- separation degree (aka distance) - the context of social network uses degree to indicate the number of edges separating 2 vertices. This use comes from Six degrees separation theory stating that people are separated between them by at most 6 edges. More commonly the number of edges between vertices is called distance. The degree was preferred here just to emphasize the context of use.
- use cases - a graph is a good structure to represent relationships or interactions. It helps to solve the problems of: shortest path, clustering, page rank, minimum cut, recommendation or connected components.
Graph data distribution
One of main graph problems in Big Data context is partitioning. A lot of real-world graphs "suffer" from Power Law rule. Shortly speaking, this law tells that some vertices have more important impact on the graph than the others. This impact translates by degree of these vertices. The following curve shows that:
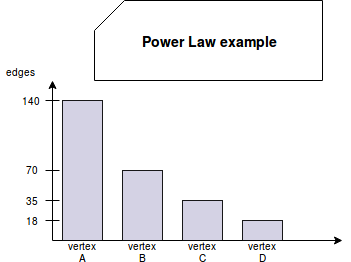
As you can see, the first vertex has X percentage points more than the second. In its turn, the second has X percentage points more than the third. The third also has the same difference with the fourth and so forth.
Another problem with graph partitioning is related to dynamic graphs. Partitioning a static graph is much simpler than doing that for a graph constantly changing. The distribution that seems right at current time may become wrong a week later when for instance new hotspots appear.
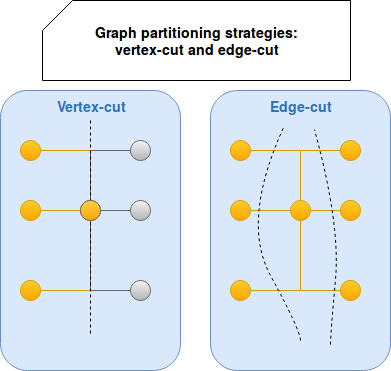
To mitigate both of them, the scientific word works hard and proposes a lot of different distribution algorithms. In graph context we often consider partitions as cuts. From that 2 different distribution approaches exist, applied either on edges or on vertices. The first approach is edge-cut and the name suggests, it cuts the graph by edges. In result of this the graph vertices are assigned to different partitions. It brings a risk to allocate connected vertices on different machines and thus the need of network communication to get the edge. To reduce this risk the adjacent vertices are often placed on the same partition. But since we talk about assigning vertices, we can immediately find out that it would probably lead to uneven distribution because of Power Law. It's why another strategy, vertex-cut, uses different idea. It cuts graph by vertices and distributes edges. The following image sums up these 2 strategies:
Graphs processing
The reflection about graph processing technique should start with MapReduce approach, widely adopted by most of Big Data frameworks. But it's not well suited to graphs because a lot of graph algorithms are iterative. In the case of MapReduce it would mean the necessity to pass graph state at every computation stage, complex joins and also a lot of I/O work increasing with each new iteration. It's why more efficient processing strategies exists and 2 of them gained a lot of popularity nowadays.
The first approach is called vertex-centric or "Think like a vertex". It puts the vertices in the center of computation. The program is divided in iterations called supersteps. In each superstep an user defined processing function applies on all graph vertices. The iteration stops when all vertices execute the function. Some of vertices can later propagate the result of their computation to other vertices in the form of message.
Another strategy is known as graph-centric or, as "Think like a graph" slogan. It's a response to one of vertex-centric programs problem about a big number of iterations. Sometimes 2 vertices located on the same partition need multiple iterations before they're finally able to communicate together. The communication in vertex-centric paradigm is often limited to a vertex and its neighbours. Graph-centric computation model works differently. It splits a whole graph on smaller subgraphs. The processing is executed directly on the subgraphs and the results computed by boundary vertices (= vertices present in different subgraphs) are exchanged at each iteration. These 2 approaches will be detailed more in the next articles devoted to distributed graphs.
The goal of this post was to provide a global overview of graphs in the context of Big Data. But it started with a section devoted to general concepts of graph as a data structure. It'll help to better understand the data processing examples given in next articles. Two next parts described more the context of graph as a data tool. One of them shown partitioning strategies and proven that sharding graphs was not an easy task because of Power Law. The next part given a small insight on data processing paradigms oriented around vertex and subgraph ideas. But as told, it was only an introduction to gather the same level of knowledge before the next posts talking about graphs in the context of data processing more in details.
Data Engineering Design Patterns
Looking for a book that defines and solves most common data engineering problems? I wrote
one on that topic! You can read it online
on the O'Reilly platform,
or get a print copy on Amazon.
I also help solve your data engineering problems contact@waitingforcode.com 📩
Read also about Graphs and data processing here:
- Six degrees of separation Chapter 35. Graph Partitioning Graph Databases: Their Power and Limitations Graph partition Part II: Distributed Graph Processing
Related blog posts:
- Bipartite graph recommendation example
- Chaos in streaming graph processing
- Graph processing frameworks survey
After several months passed in my backlog, #graph s are coming as a new #data category in waitingforcode. There is nothing better than a post with some generic information to start the learning process calmly,: https://t.co/7ACYjRJQIb pic.twitter.com/SRRVW8tXRG
— bardev (@waitingforcode) October 11, 2018