
Understanding the architecture is the key of working properly with any distributed system. It's why the series of post about Gnocchi starts by exploring its components.
What would it take for you to trust your Databricks pipelines in production?
A 3-day bug hunt on a 3-person team costs up to €7,200 in lost engineering time. This workshop teaches you to prevent that — unit tests, data tests, and integration tests for PySpark and Databricks Lakeflow, including Spark Declarative Pipelines.

Konieczny
The first section of this post presents the general overview of the architecture. The next parts detail each of the parts composing it: input data handlers, aggregation daemon and data exposition part.
General overview
The required service to make Gnocchi work are presented in the following schema. Since this post goes a little bit deeper than in the architecture image of the official documentation, we focus here on low-level services:
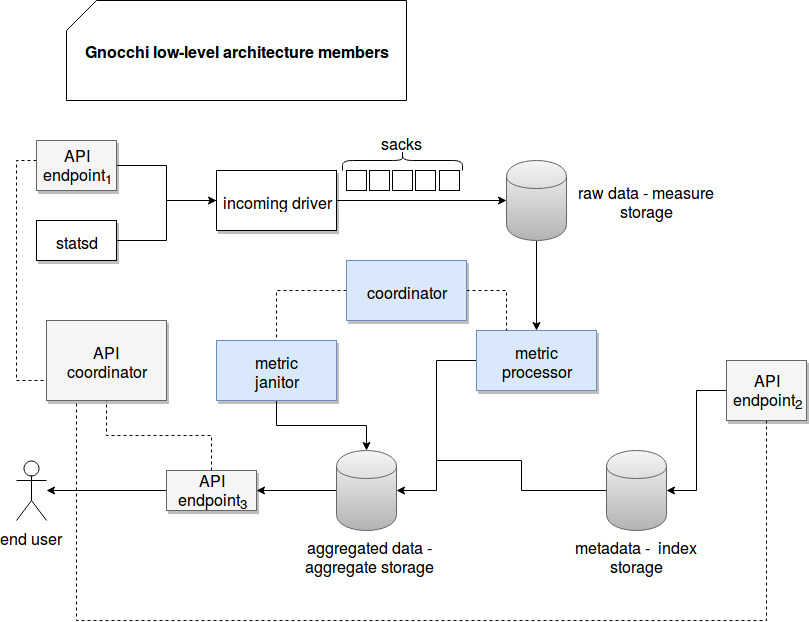
The data workflow seems pretty clear. On the beginning raw input data is handled either by an API endpoint or a statsd daemon. So collected entries are further sent to the object called incoming driver that splits them into buckets/partitions (sacks in Gnocchi terminology) and sends them to the measure storage. Later the data is read by a metric processor services that, together with the metadata stored in the index storage, computes the aggregated results. Such computed results are later returned to end user through another API endpoint. Apart of that we can find an API endpoint used to enrich the index storage and a metric janitor that physically removes not used metrics.
We can clearly notice the approach adopted by Gnocchi that consists on precomputing the aggregates. It obviously brings an important advantage of better performance but also makes the system less flexibile.
Input data handlers
As shown in the schema, the input data can be sent by 2 different methods: with an API endpoint or a statsd daemon. The API endpoint responsible for metrics ingestion is hidden behind the /metric/$metricId/measures URI invoked with POST HTTP request. The body of the request must be constituted of the measures in the form of a JSON array as in the following snippet:
[
  {"timestamp":"2017-10-06T14:33:57","value":23.1},
  {"timestamp":"2017-10-06T14:34:57","value":42.1},
  {"timestamp":"2017-10-06T14:35:57","value":41.1}
]
The request is later translated and sent to gnocchi.incoming.IncomingDriver#add_measures(self, metric_id, measures). Similar operation happens for statsd daemon. However, the measures are bufferized and flushed at regular interval to the incoming driver. And as you can see in the diagram above, the incoming driver is in charge of putting the input data into the buckets called sacks.
A sack is the parallelization unit in Gnocchi that will be covered more in details in incoming posts. So divided data is later read by the aggregators in order to make the parallel processing of multiple measures possible. The sack for specific metric is computed with the following formula:
def sack_for_metric(self, metric_id):
    return metric_id.int % self.NUM_SACKS
The IncomingDriver is in fact abstract and the logic writing the sacks to the measure storage is implemented in one of the concrete classes: CephStorage, FileStorage, RedisStorage, S3Storage or SwiftStorage. According to the official documentation, a good choice for efficient storage layer at this level is in-memory Redis key-value store: "A typical recommendation for medium to large scale deployment is to use Redis as an incoming measure storage and Ceph as an aggregate storage."
Indexer
Before going to the data processing step we must pass by the indexation stage. Here Gnocchi saves the metadata about the resources and metrics. A resource can be considered as a category grouping one or more metrics. For instance, it can be a node to which we'll associate the metrics like CPU use, occupied/free memory ratio etc. Thus a metric is one property that will be measured across the time. It's characterized by the archive policy defining the aggregation methods and time granularity. They're then very important in the process of aggregation and it's why we can see a double arrow going to the aggregate storage. All these concepts will also be covered more in details in one of further posts.
The metadata stored in the index storage can be added through another API endpoint: /metric or /resource/$resourceType ($resourceType can be one of existent ones as generic or a created one via another endpoint). The request is handled by appropriate controller and passed to the gnocchi.indexer.IndexerDriver#create_resource(resource_type, id, creator,user_id=None, project_id=None, started_at=None, ended_at=None, metrics=None, **kwargs) or gnocchi.indexer.IndexerDriver#create_resource(resource_type, id, creator, user_id=None, project_id=None, started_at=None, ended_at=None, metrics=None, **kwargs) .
As in the case of IncomingDriver, the IndexDriver is also abstract. But unlike the IncomingDriver, it has only 1 implementation - SQLAlchemyIndexer that saves the entities to a RDBMS. Currently only PostgreSQL and MySQL are supported.
Aggregation daemon
Gnocchi prepares the final data before making it available to end users. We can then consider this aggregation part as one of the most important in the architecture. A daemon in charge of the aggregation is called metricd and it does 2 things: computes new aggregates and removes the metrics having the status field set to delete. Let's explain the first operation. The new metrics are processed by the instances of gnocchi.cli.metricd.MetricProcessor inside the _run_job method executed at a regular time interval. The job polls new metrics to process from the measure storage with the delay defined in metric_processing_delay configuration parameter. The workload is spread among the available workers with the help of the coordinator.
The processing itself consists on getting the sacks to process, querying IncomingDriver to retriev new measures and passing them to gnocchi.storage.StorageDriver#process_new_measures(self, indexer, incoming, metrics_to_process, sync=False). It's here where the interaction with index storage happens. The index is used to get all active metrics for aggregated measures. After the aggregation the results are persisted through gnocchi.storage.StorageDriver#_store_unaggregated_timeserie(metric, data, version=3).
As told above, only the active metrics are processed. The inactive ones, even though the measures are collected, are ignored. They're cleaned at a regular interval by MetricJanitor. This object removes the metrics marked as deleted with all their unprocessed measures. Thus it interacts with the measures and index storage.
Data retrieval
The data is exposed through an API endpoint /metric/$metricId/measures. The time series are queried with GET method and can be filtered on: time ranges (timestamps from/to), aggregation method (mean is the default) or different granularity level.
The response of the API returns an array of measures where each JSON object is composed of: the timestamp, the granularity and the aggregation value. Unfortunately the response object is a flat array so it's important to remember the order of the items in in:
[
  [
    "2018-01-01T15:00:00+00:00",
    1.0,
    12.0
  ],
  [
    "2018-01-01T15:01:00+00:00",
    1.0,
    2.0
  ]
]
At first glance the architecture of Gnocchi may appear complex. However after some investigation all components are put into a logical set. At the beginning the data is added either through an API endpoint or a stats daemon. Please notice that other ingestion methods exist but we stay focus on only these 2. Next the raw data is saved in the measure store from where it reads at regular interval by metricd daemon(s). These daemons are responsible for the aggregation of this data according to the defined archive policy. Such aggregated measures are later persisted to the aggregate storage from where they can be safely returned to the end user through another API endpoint.
Data Engineering Design Patterns

Looking for a book that defines and solves most common data engineering problems? I wrote
one on that topic! You can read it online
on the O'Reilly platform,
or get a print copy on Amazon.
I also help solve your data engineering problems contact@waitingforcode.com 📩
Read also about Gnocchi architecture here:
Related blog posts:
- Resources and metrics in Gnocchi
- Reading aggregates in Gnocchi
- Sacks - data parallelization unit in Gnocchi
- Carbonara storage format
- Choosing time-series database for study
After talking about #timeSeries databases, it's time to introduce #Gnocchi architecture https://t.co/sm2LkXieQ8 pic.twitter.com/rQwb8lA3qx
— bardev (@waitingforcode) June 10, 2018