I won't hide it, I'm still a fresher in the Apache Flink world and despite my past streaming experiences with Apache Spark Structured Streaming and GCP Dataflow, I need to learn. And to learn a new tool or concept, there is nothing better than watching some conference talks!
What would it take for you to trust your Databricks pipelines in production?
A 3-day bug hunt on a 3-person team costs up to €7,200 in lost engineering time. This workshop teaches you to prevent that — unit tests, data tests, and integration tests for PySpark and Databricks Lakeflow, including Spark Declarative Pipelines.

Konieczny
Yes, you got it right. I'm going to repeat the exercise I made for the Performance optimization lessons from Spark+AI and Data+AI Summits, and see what performance best practices we can learn from past Flink Forward!
Apache Flink Worst practices
Are you surprised to find this in the list? Konstantin Knauf shared them in his talk 3 years ago:
Delivery guarantee & consistency
Konstantin started the presentation with a great summary for choosing the checkpoint mode. Because yes, there are 2 checkpoint modes which impacts the latency and the overall results correctness.
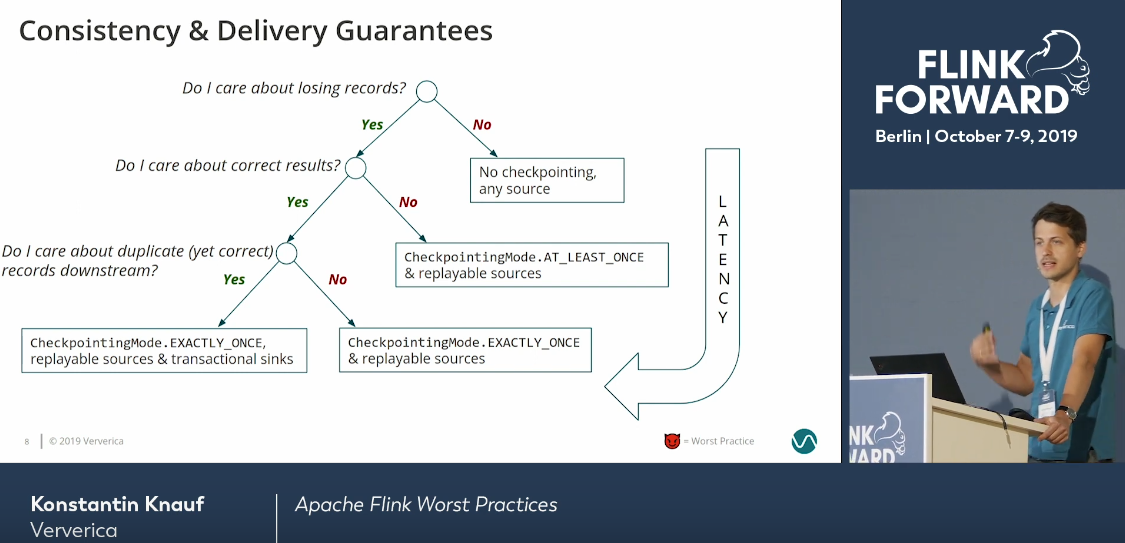
More you move to the bottom left, the worse your latency will be. On the other hand, your results will be correct. If you need weaker delivery guarantee but faster processing, you'll typically move on the right side of this decision tree.
Take the job evolution carefully
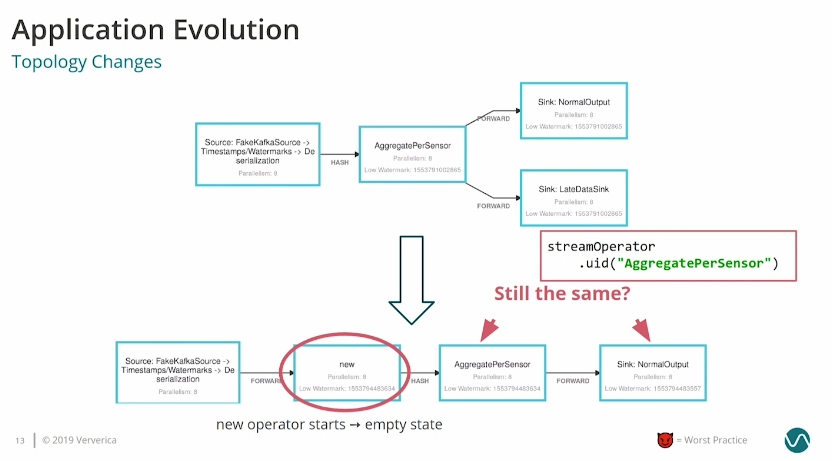
The algorithm for the job upgrade is relatively easy. You perform a savepoint, stop the job, deploy a new version that references the state in the savepoint. But you must be careful with the topology changes. As pointed out in the picture above, if you add a new operator to the dataflow, its state will be empty and you must take it into account. Additionally, it's a best practice to name the operators so that Apache Flink can match them with the restored state.
Remember the checkpoint
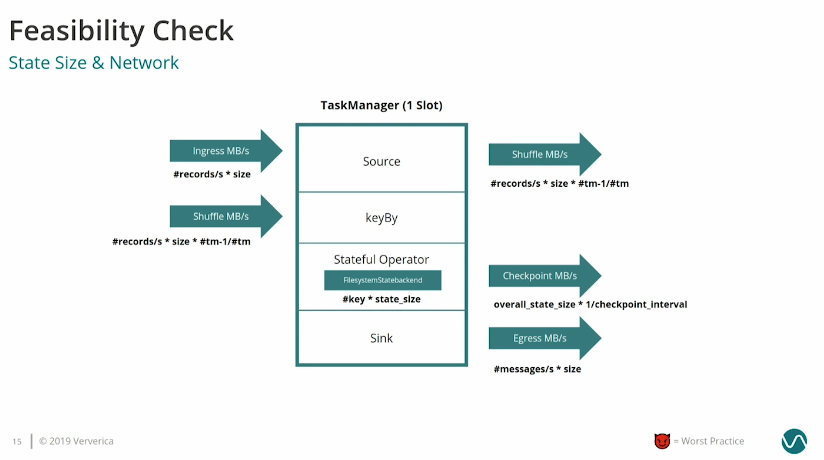
Checkpointing is a network-related process so it naturally impacts the I/O. It's especially important to keep in mind while you plan the resources and when the state size is much bigger than the input data. Konstantin presented all the resource-sensitive parts here:
Beware of the Table API
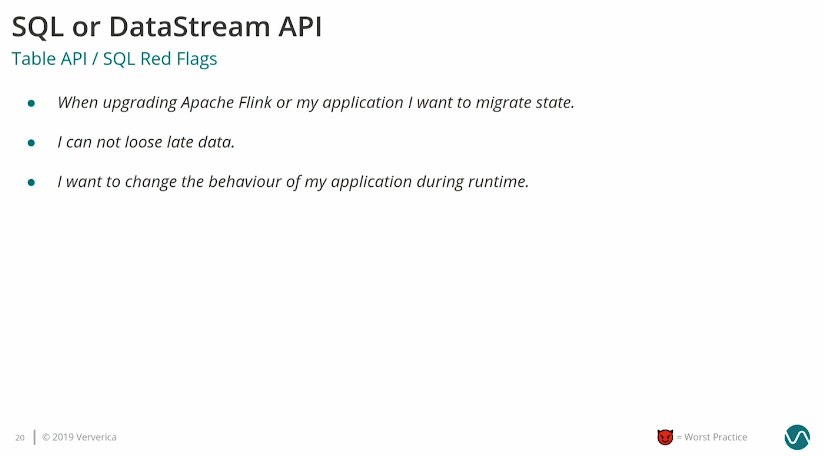
Even though using the SQL-based abstraction may be tempting, it's not always the best idea, especially when you need state management flexibility. The Table API performs many optimizations under-the-hood and as a result, when you change the query, the state may be not properly restored. There are some red flags to keep in mind while choosing one this abstraction over the DataStream API
Choose the data you need
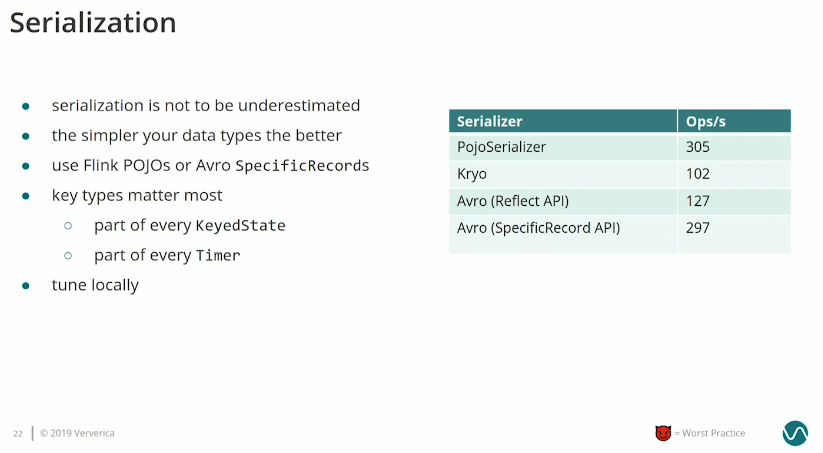
Serialization cannot be underestimated but having the most optimal serialization method is not the single important point. Even more important is to explicitly select the attributes used in the stream processing job so that the serialization is performed only on the really needed data.
Also keep the key states as simple as possible. They're part of every state object and every timer, so keys for keyed states will be serialized/deserialized many times. This process for simple types will perform the best.
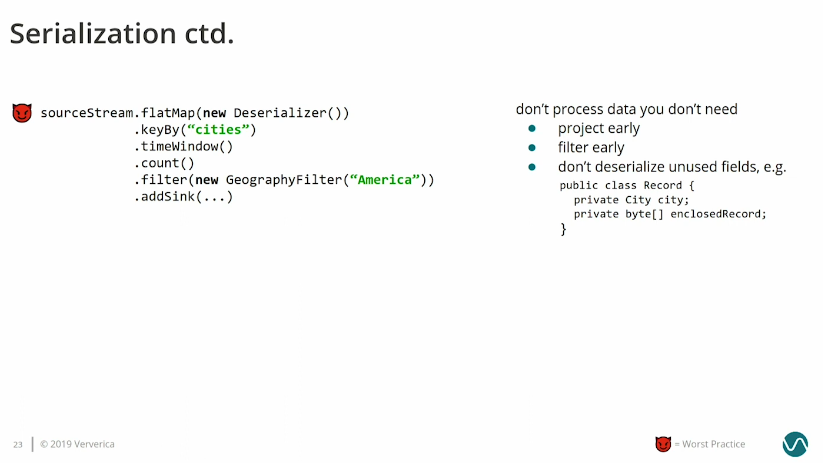
Another impactful feature for the serialization is the dataset reduction before any heavy operation. So remember, filter out early and choose only what's necessary.
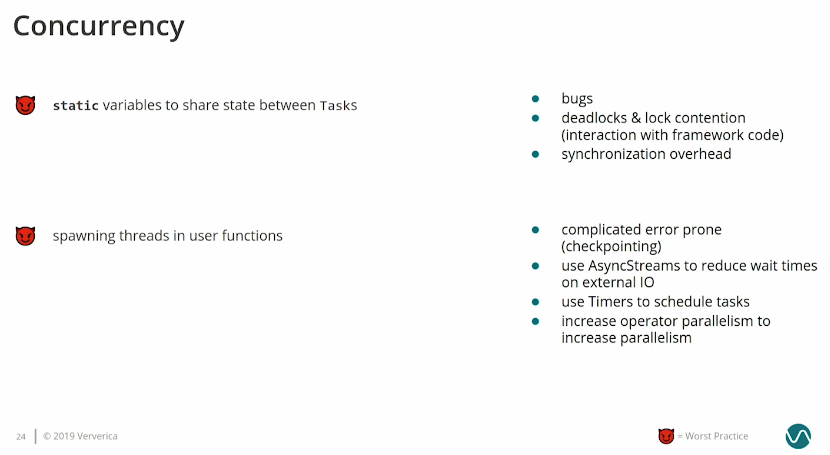
Avoid low-level concurrency
They may be sources of many problems, deadlocks included!
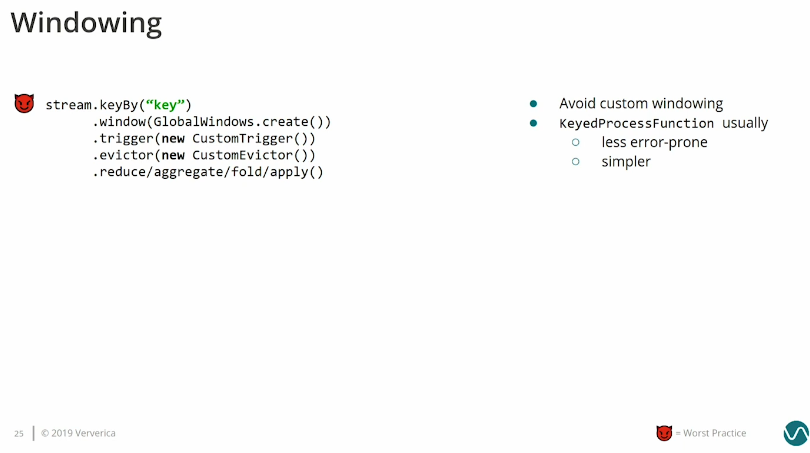
Custom window
Rely on the KeyedProcessFunction for the sake of simplicity and easier control on the outcome instead of custom window:
Classic errors
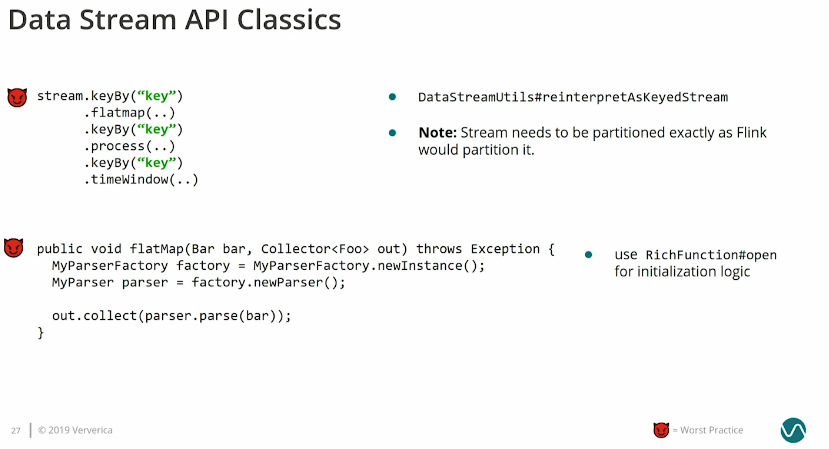
For many keyed-by transformations, think about DataStreamUtils#reinterpretAsKeyedStream to reduce the serialization. Besides, keep the object initialization aside and do it only once, e.g. in the RichFunction#open method:
Test facilities
Apache Flink comes with a whole dedicated components for testing:
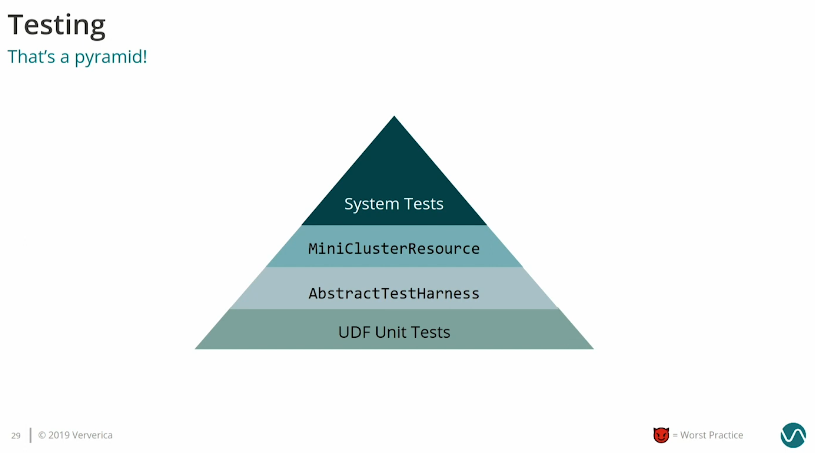
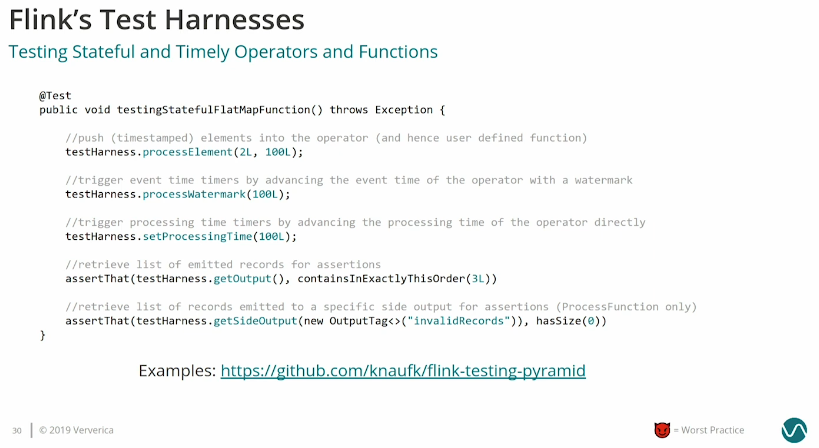
Besides the classes, it also has an orchestration code:
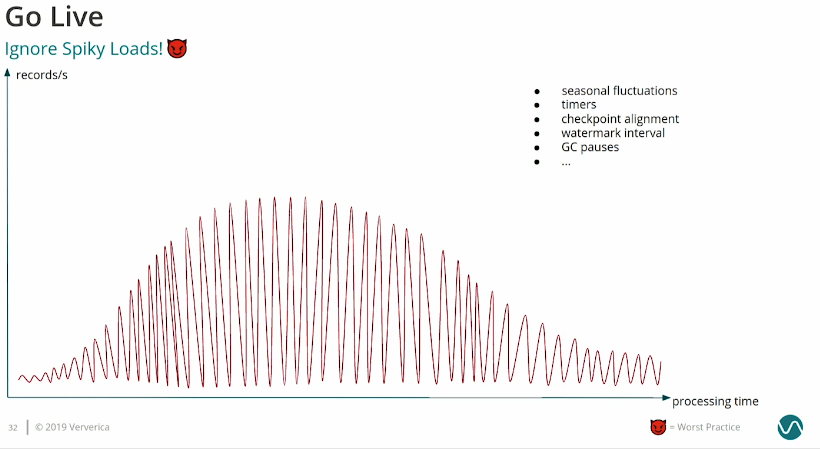
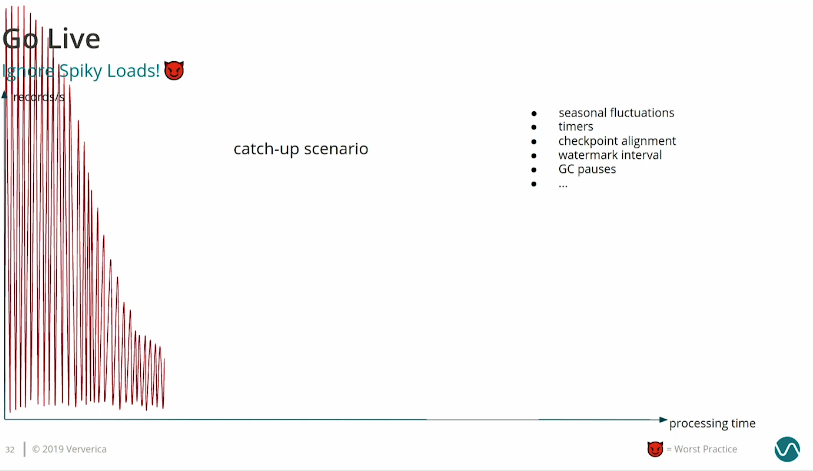
Catch-up scenario
One of the best ways to see the resilience of the job is to run it in a catch-up scenario where all spikes will happen more often and generally the pressure on the job and infrastructure will be heavier:
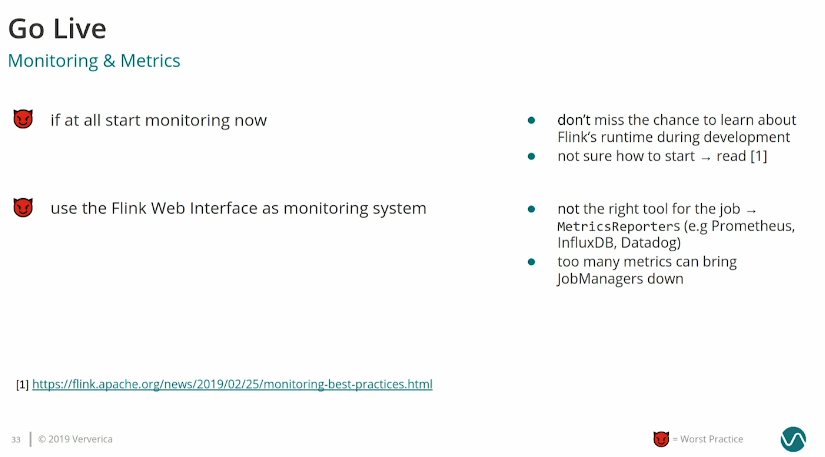
Monitoring
Do not rely on Flink UI for the monitoring purposes. Although it can be a good way to quickly jump in and understand the most recent events, it's not intended to be the first-class monitoring tool. Additionally, to many queried metrics can bring the job down.
A Debuggers Guide to Apache Flink Streaming Applications
Writing an application is hard but debugging it, especially for the legacy jobs, is even harder. Thankfully, Alexander Fedulov shared several useful tips in his talk!
Useful monitoring metrics
One way to start your debugging session is to analyze the monitoring metrics. Alexander mentioned several important metrics for Apache Flink jobs: throughput which is the correlation between the input and the output, consumer lag which is the data freshness marker, and checkpoint.
Backpressure
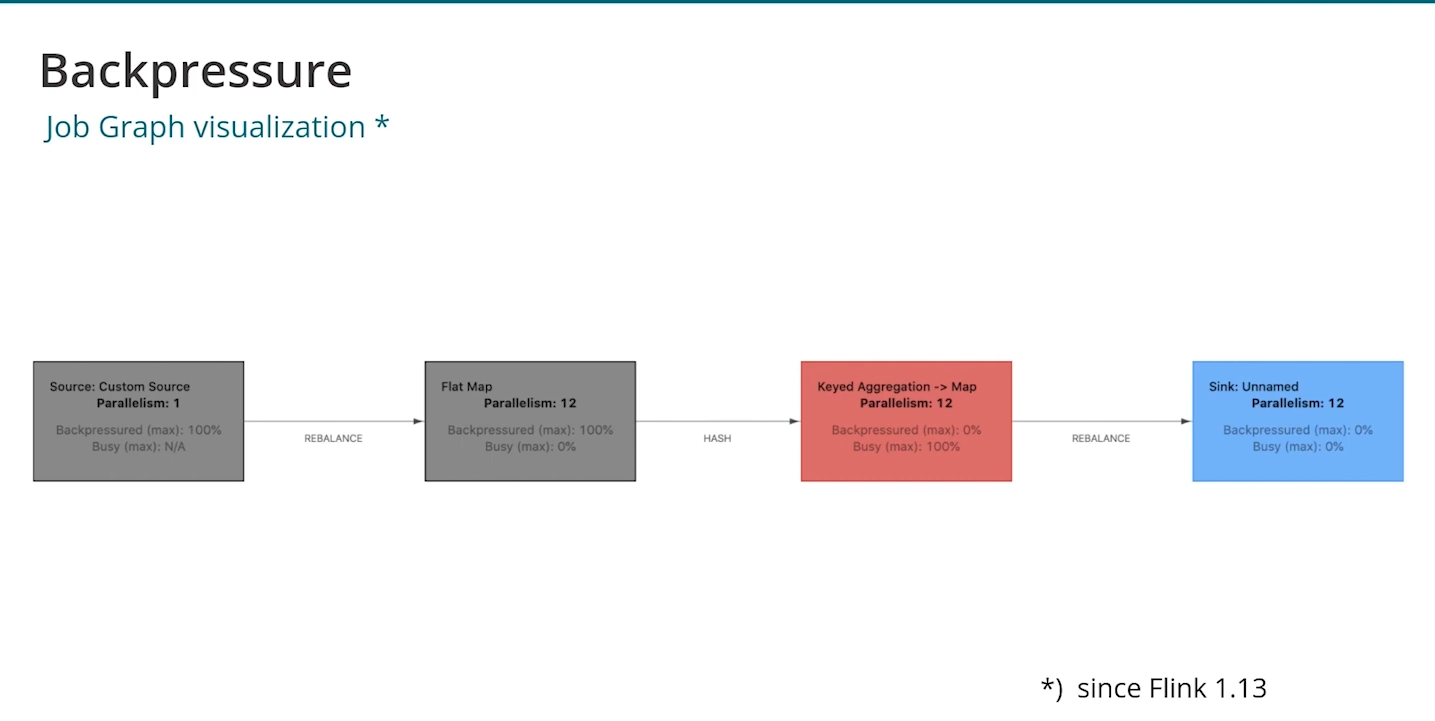
The backpressure occurs when the job cannot process the data fast enough. Alexander said something pretty important in that regard: "It's good to have it (in Apache Flink) but it's not so good to have it in your application". With the backpressure the data is probably unbalanced and one worker has much more pressure that the others which may impact other things, such as checkpointing.
Alexander also mentioned how to spot backpressured operators. With Apache Flink's color scheme is quite simple. A fully busy operator is marked in red while a backpressured one is gray. From that it's also easy to detect the source of the backpressure. It's the grey operator next to backpressured ones (Keyed aggregation from the screenshot):
Data skew
The backpressure might not be necessarily caused by the data skew. If you want to check this hypothesis, you can also analyze the subtasks view:
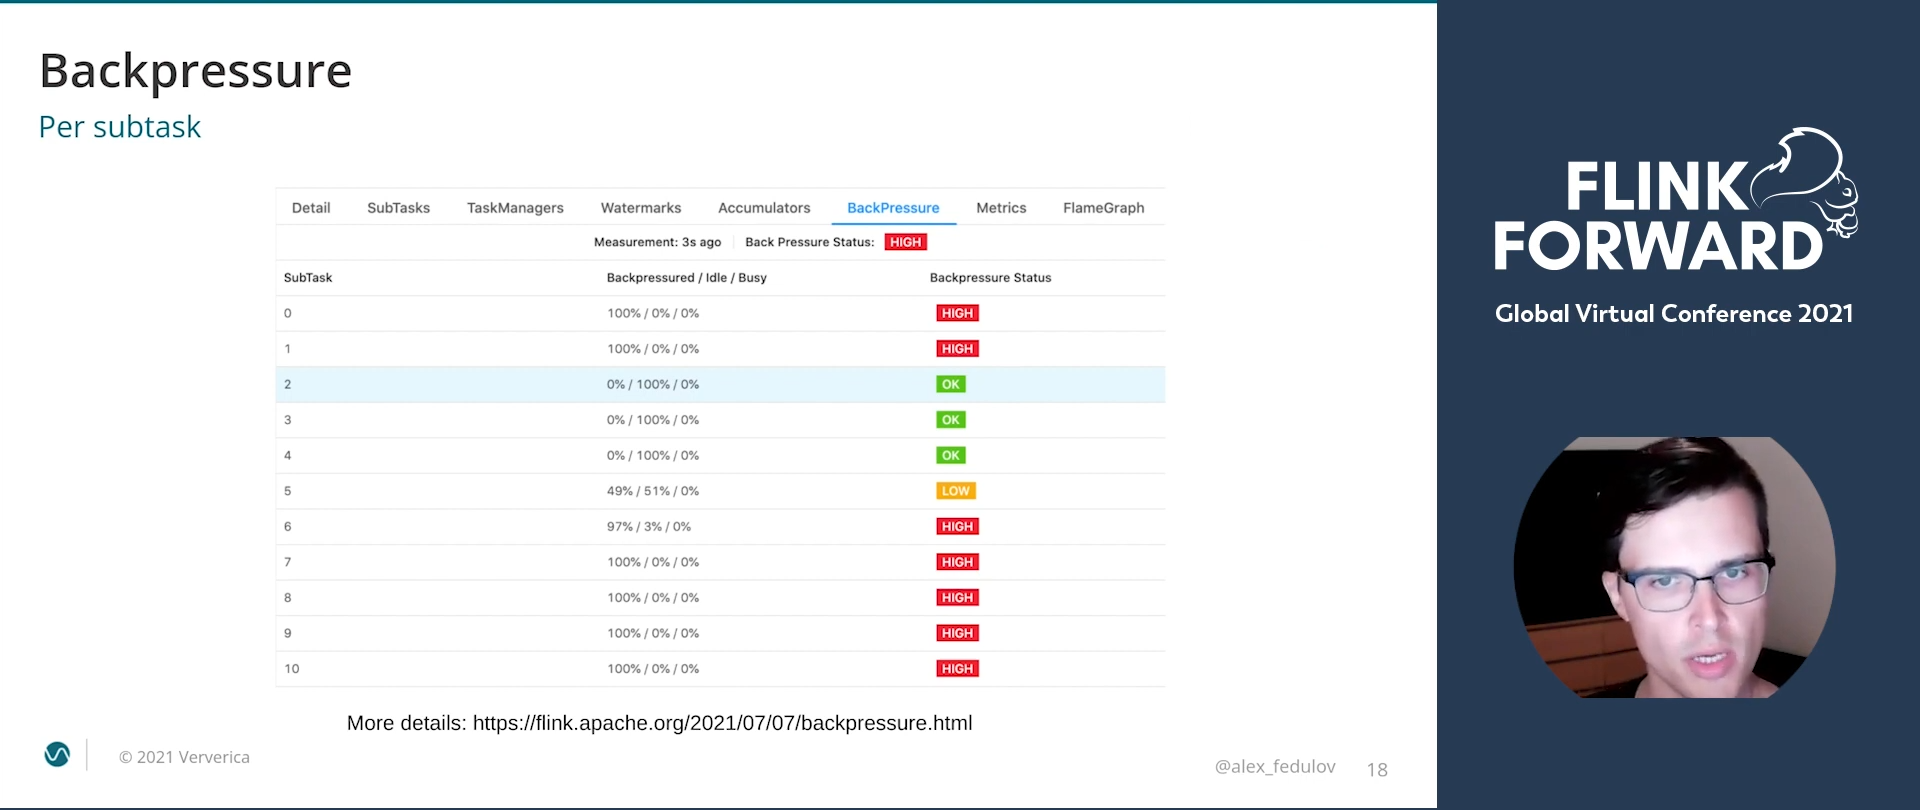
If you see the pattern from the screenshot where some tasks are backpressure while the others are idle, it can be the sign of data skew. Additionally, you can rely on the checkpoint metrics to confirm the skew:
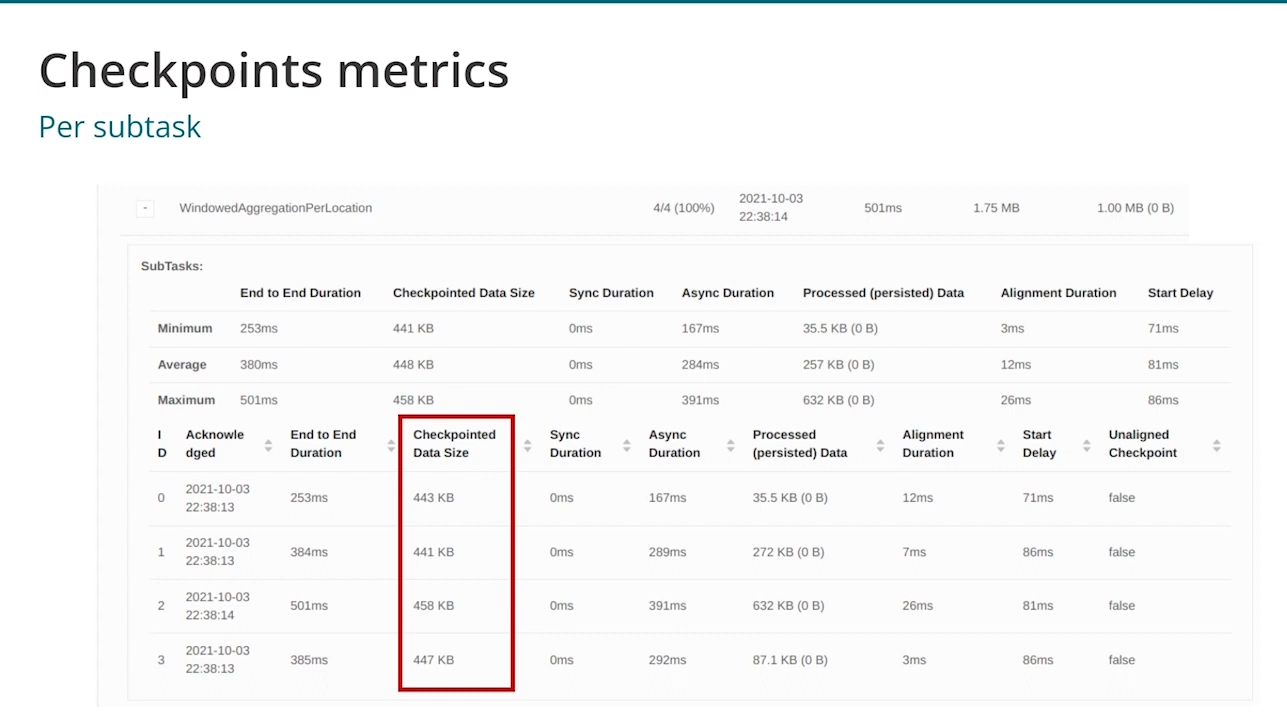
To overcome the data skew, there are solutions you might know from Apache Spark, such as using a different key or adding some salt and using a map-reduce-like operation. Additionally, if you decide to scale up, make sure you scale up all resources accordingly, e.g. you must get additional IOPS for writing state data on RocksDB.
Code profiling
Local debugging is often more beneficial than the remote. Here is why:
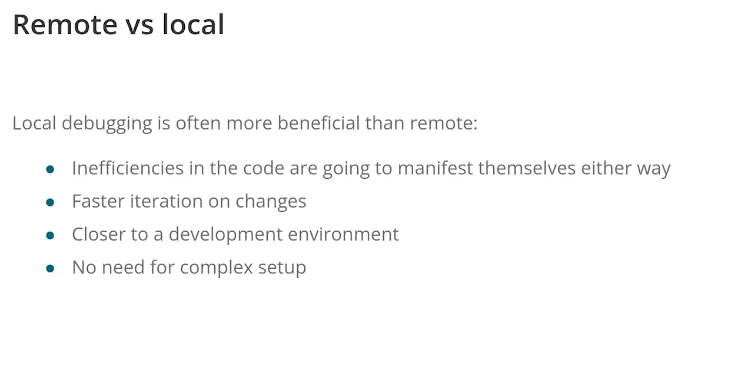
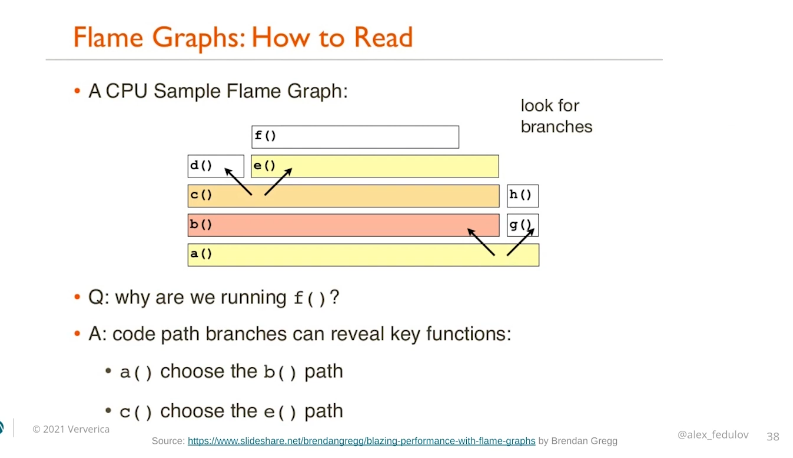
If for whatever reason you need to investigate the JVM of the running jobs, Flame Graphs will probably be your friend. The feature exposes different thread statistics and doesn't impact the processing latency that much. If you don't know how to read them, Alexander shared some interesting tips but this slide should be the most self-explanatory:
Sources, Sinks, and Operators: A Performance Deep Dive
For the last talk analyzed here I focused on the one given by Brent Davis about the sources and sinks. The talk has some interesting learnings and performance optimization tips.
Checkpoint alignment
The checkpoint alignment time is "the time between the first checkpoint barrier arriving to an operator and the last".
Slots spread-out
It's important to guarantee an even slots distribution for the tasks execution. Apache Flink has a parameter called cluster.evently-spread-out-slots that ensures the even slots distribution among task slots. If it's disabled, a single JVM take get more load than the others and this resource pressure can have a negative impact on the overall performance.
DataStreamUtils
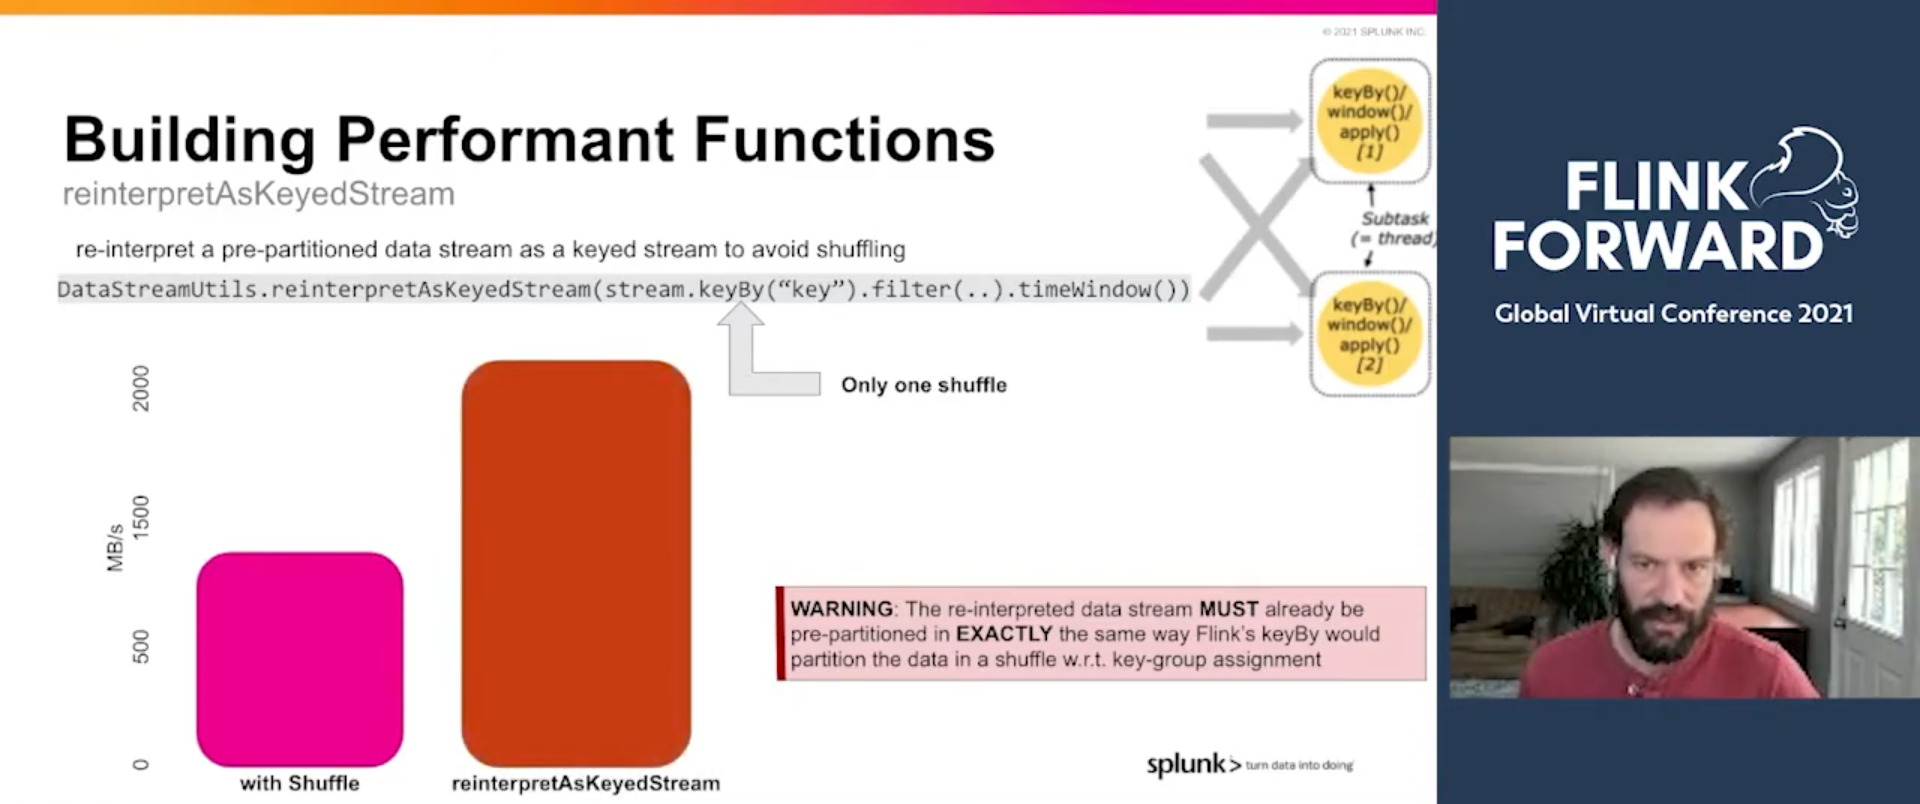
You know it already, shuffle is costly because of the network traffic and the serialization and deserialization cost. But if you can guarantee than the data in the source is partitioned as the Flink would need this, you can use the DataStreamUtils#reinterpretAsKeyedStream to avoid the shuffle in the keyBy operations. It improves the performances drastically!
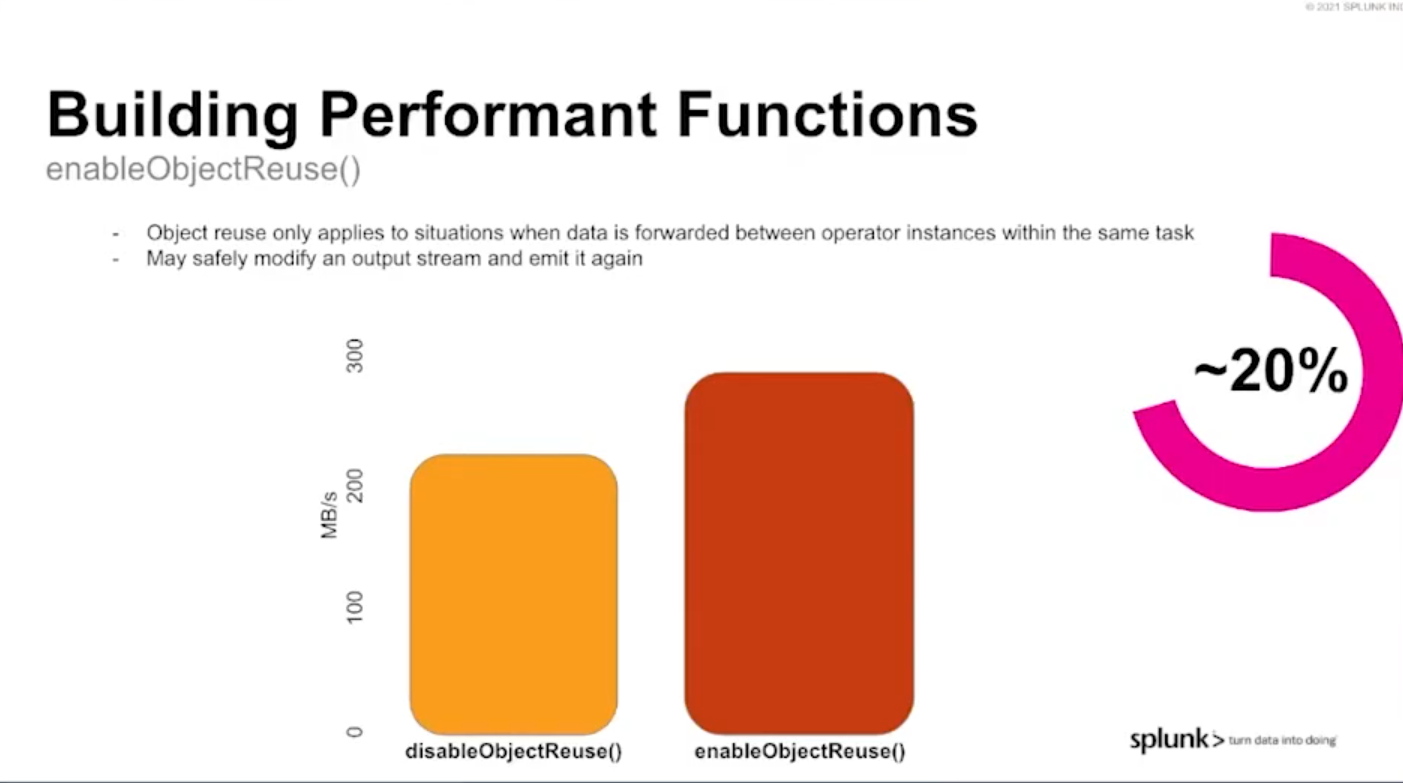
Objects reuse
Besides the key-based shuffle optimization, there is also an enableObjectsReuse setting that can greatly reduce the JVM pressure (especially GC) by using the same object instances on the operators outputs (if applicable).
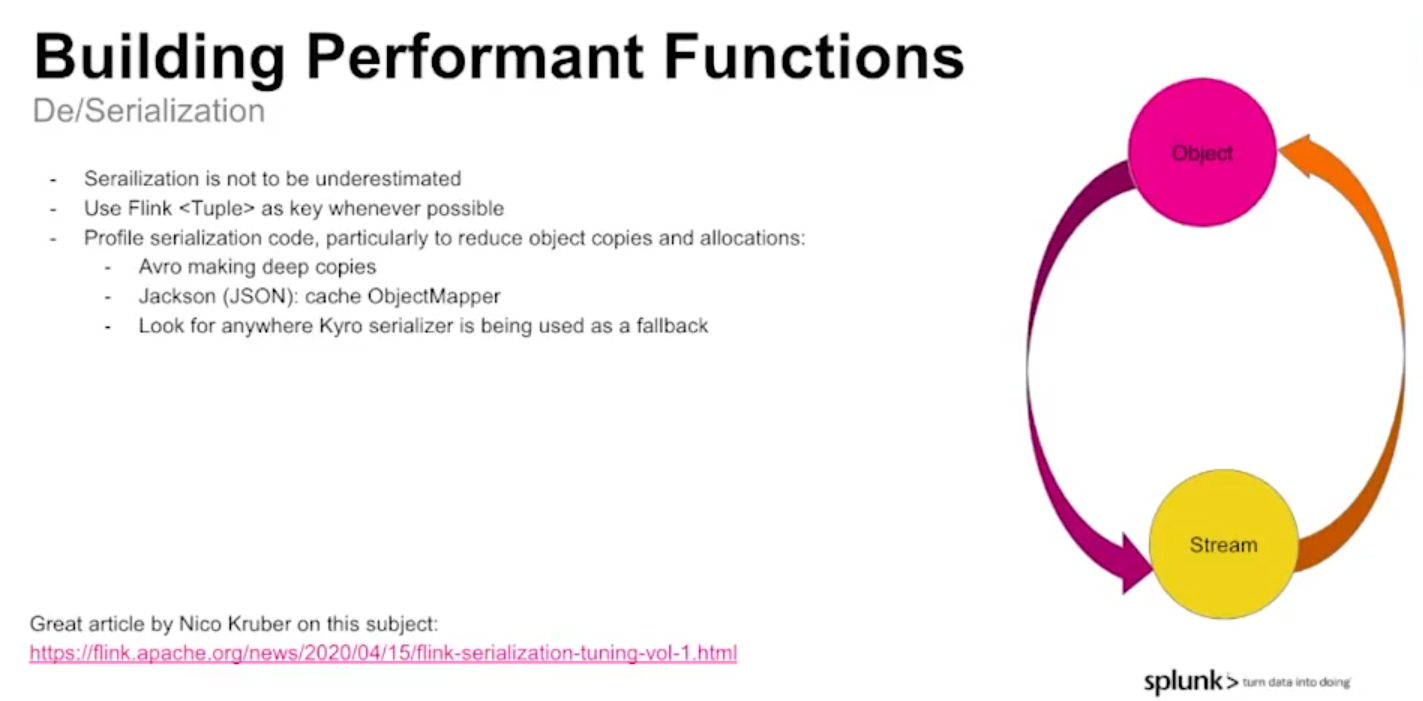
Serialization
Serialization/deserialization has often a significant impact on job performance. Brent shared several ways to improve it in this slide:
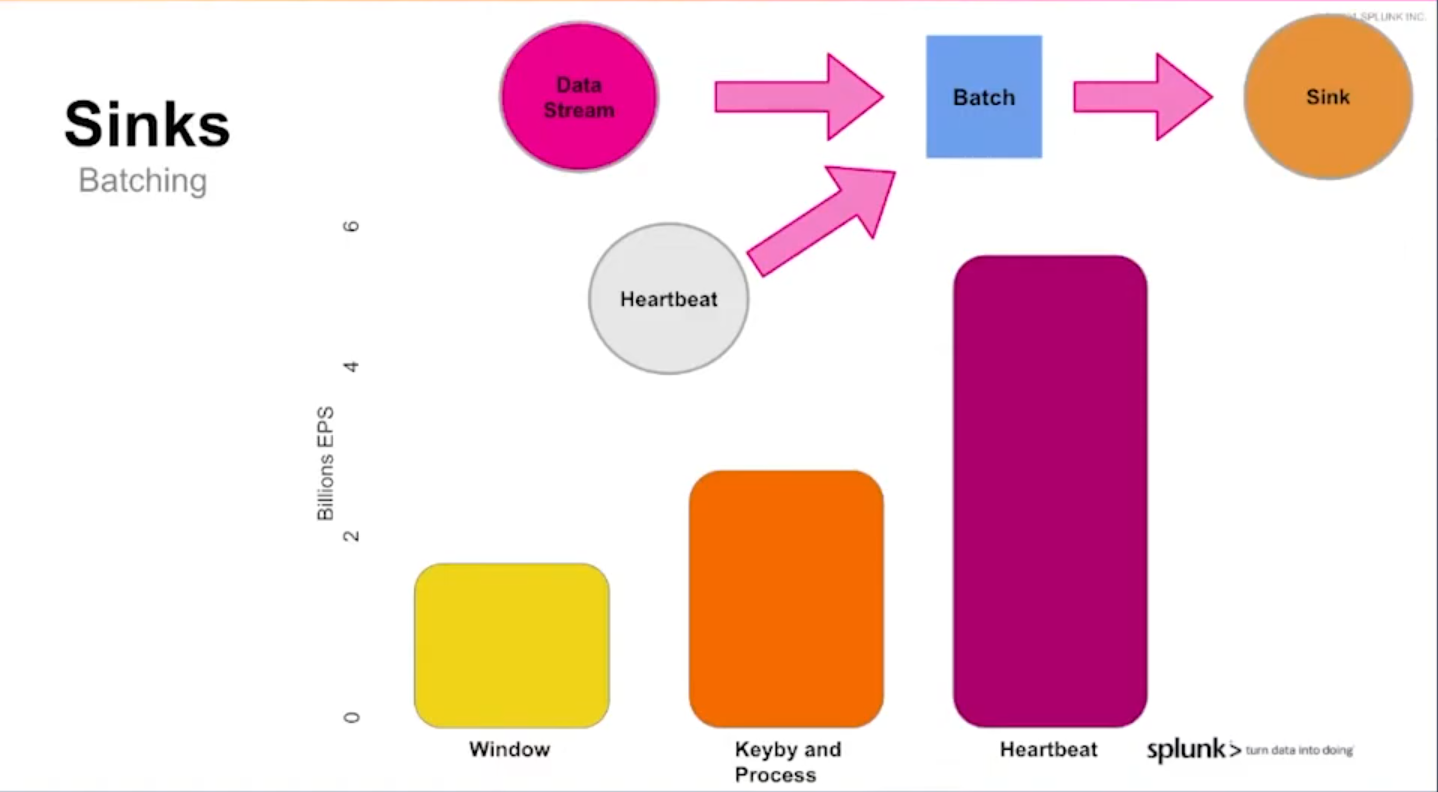
Batching in sinks
Brent with his team tested 3 various ways for flushing the records to the sinks. There is no mystery, batch-based flush optimized the throughput but it can be done differently and each way has its own performance footprint.
The classical window-based approach was the slowest one. It was worse than the key-by operation followed by the output operator task. But this solution too has a better alternative consisting of using an side input stream that sends heartbeats to the main events stream. Once the heartbeat received by the sink operator, the data accumulated in memory gets flushed to the sink. With that approach the throughput is almost x3 bigger.
Tech conferences are a great way to learn fast from the smartest people. I'll definitely take this shortcut to improve my Apache Flink knowledge. Discovering things like the DataStreamUtils class, or the checkpoints importance would take ages without these great talks! The bad news for me, there are many more to watch and still 24 hours per day...
Data Engineering Design Patterns

Looking for a book that defines and solves most common data engineering problems? I wrote
one on that topic! You can read it online
on the O'Reilly platform,
or get a print copy on Amazon.
I also help solve your data engineering problems contact@waitingforcode.com 📩

