
There are 2 popular ways to come to the data engineering field. Either you were a software engineer and you were fascinated by the data domain and its problems (I did). Or simply you evolved from a BI Developer. The big advantage of the latter path is that these people spent a lot of time on writing SQL queries and their knowledge of its functions is much better than for the people from the first category. This post is written by a data-from-software engineer who discovered that aggregation is not only about simple arithmetic values but also about distributions and collections.
What would it take for you to trust your Databricks pipelines in production?
A 3-day bug hunt on a 3-person team costs up to €7,200 in lost engineering time. This workshop teaches you to prevent that — unit tests, data tests, and integration tests for PySpark and Databricks Lakeflow, including Spark Declarative Pipelines.

Konieczny
I wrote this post because I was looking for different execution models of aggregation queries. And since the "classical" aggregations all executed almost the same way, I found some less common ones. The article is composed of multiple short parts where each of them describes one aggregation less popular than COUNT, SUM or AVG. I listed the function in alphabetical order to retrieve them easier. I also omitted mathematical formulas to not bother you with too many details but if you want, you will retrieve them in the links from "Read more" section.
collect_list
The first 2 functions will work on collections. collect_list(columnName: String) groups all values from columnName into a list. And since it's a list, the result can contain duplicates:
  "collect_list" should "collect all values into a list" in {
    import sparkSession.implicits._
    val dataset = Seq(
      (1, "a"), (1, "aa"), (1, "a"), (2, "b"), (2, "b"), (3, "c"), (3, "c")
    ).toDF("nr", "letter")

    val result = dataset.groupBy("nr").agg(functions.collect_list("letter").as("collected_letters"))
      .map(row =>
        (row.getAs[Integer]("nr"), row.getAs[Seq[String]]("collected_letters"))
      ).collect()

    result should have size 3
    result should contain allOf(
      (1, Seq("a", "aa", "a")),
      (2, Seq("b", "b")),
      (3, Seq("c", "c"))
    )
  }
collect_set
collect_set(columnName: String) is very similar to collect_list aggregation. It also collects all values but it eliminates the duplicated ones:
  "collect_set" should "collect all values into a set and therefore, drop duplicates" in {
    import sparkSession.implicits._
    val dataset = Seq(
      (1, "a"), (1, "aa"), (1, "a"), (2, "b"), (2, "b"), (3, "c"), (3, "c")
    ).toDF("nr", "letter")

    val result = dataset.groupBy("nr").agg(functions.collect_set("letter").as("collected_letters"))
      .map(row =>
        (row.getAs[Integer]("nr"), row.getAs[Seq[String]]("collected_letters"))
      ).collect()

    result should have size 3
    result should contain allOf(
      (1, Seq("a", "aa")),
      (2, Seq("b")),
      (3, Seq("c"))
    )
  }
corr
corr(columnName1: String, columnName2: String) returns the Pearson Correlation Coefficient for two columns. Sounds mysterious? This statistical function analyzes the correlation between the values defined in the 2 columns of each group. It returns a value between -1 and 1 where -1 means a total negative correlation, 0 no linear correlation and 1 a total positive correlation. Still mysterious?
A negative correlation occurs when one variable increases and the one decreases. A positive correlation takes place when both variables move in the same direction, so either they increase or decrease. A no linear correlation means that for every increase, there isn't a positive or negative increase:
  "corr" should "compute correlation between the 2 columns in a dataset" in {
    import sparkSession.implicits._
    val dataset = Seq(
      (1, 1, 10), (1, 2, 20), (1, 3, 30), // positive correlation
      (2, 1, 2), (2, 2, 1), (2, 3, 3), (2, 4, 2),  (2, 4, 2),  (2, 4, 2),  (2, 4, 2),  (2, 4, 2),
      (3, 31, 15), (3, 32, 14) // negative correlation
    ).toDF("nr1", "nr2", "nr3")

    val result = dataset.groupBy("nr1").agg(functions.corr("nr2", "nr3").as("correlation"))
      .map(row => (row.getAs[Int]("nr1"), row.getAs[Double]("correlation")))
      .collect()

    result should have size 3
    result should contain allOf(
      (1, 1.0d),
      (2, 0.22941573387056163d),
      (3, -1.0d)
    )
  }
covar_pop
covar_pop(columnName1: String, columnName2: String) is another statistical function. It computes a covariance for the whole dataset (population), ie. a joint variability of two random variables. In finance domain you can use it to figure out the dependency of 2 shares. A lower covariance means that these 2 shares are independent. A higher variance means a stronger relationship between them:
  "covar_pop" should "compute covariance for 2 columns of a dataset" in {
    import sparkSession.implicits._
    val dataset = Seq(
      (1, 1, 10), (1, 2, 20), (1, 3, 30),
      (2, 1, 20), (2, 2, 19), (2, 3, 10), (2, 15, 10),
      (3, 31, 15), (3, 30, 14), (3, 29, 24), (3, 36, 24)
    ).toDF("nr1", "nr2", "nr3")

    val result = dataset.groupBy("nr1").agg(functions.covar_pop("nr2", "nr2").as("covar_pop"))
      .map(row => (row.getAs[Int]("nr1"), row.getAs[Double]("covar_pop")))
      .collect()

    result should have size 3
    result should contain allOf(
      (1, 0.6666666666666666d),
      (2, 32.1875d),
      (3, 7.25d)
    )
  }
covar_samp
covar_samp(columnName1: String, columnName2: String) also computes covariance but which applies on the sample of the dataset:
  "covar_samp" should "compute sample covariance for 2 columns of a dataset" in {
    import sparkSession.implicits._
    val dataset = Seq(
      (1, 1, 10), (1, 2, 20), (1, 3, 30),
      (2, 1, 20), (2, 2, 19), (2, 3, 10), (2, 15, 10),
      (3, 31, 15), (3, 30, 14), (3, 29, 24), (3, 36, 24)
    ).toDF("nr1", "nr2", "nr3")

    val result = dataset.groupBy("nr1").agg(functions.covar_samp("nr2", "nr2").as("covar_samp"))
      .map(row => (row.getAs[Int]("nr1"), row.getAs[Double]("covar_samp")))
      .collect()

    result should have size 3
    result should contain allOf(
      (1, 1.0d),
      (2, 42.916666666666664d),
      (3, 9.666666666666666d)
    )
  }
first
first(columnName: String) returns the first value for every group. An important point to notice here is that it's non-deterministic because of shuffle operation which itself is not deterministic:
  "first" should "return the first value from the aggregated group" in {
    import sparkSession.implicits._
    val dataset = Seq(
      (1, 11), (1, 12), (1, 13), (2, 21), (2, 22), (3, 31), (3, 32)
    ).toDF("nr1", "nr2")

    val result = dataset.groupBy("nr1").agg(functions.first("nr2").as("first_value")).collect()

    // first is not deterministic, so it can return different values for consecutive runs
    // That's why I'm making here a more complicated assertion on the content
    result should have size 3
    val acceptableValues = Map(1 -> Set(11, 12, 13), 2 -> Set(21, 22), 3 -> Set(31, 32))
    result.foreach(row => {
      val id = row.getAs[Int]("nr1")
      val firstNumber = row.getAs[Int] ("first_value")
      acceptableValues(id) should contain (firstNumber)
    })
  }
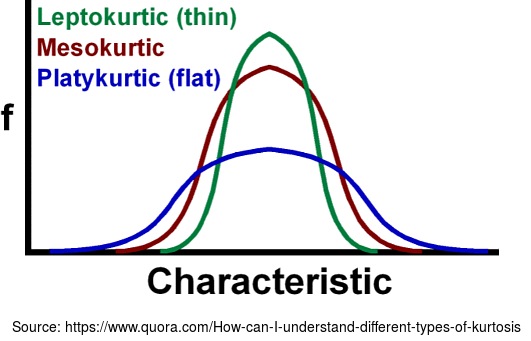
kurtosis
kurtosis(columnName: String) function helps to determine whether tails of a given distribution group contains extreme values, or in other words, whether the distribution is less or more peaked than the normal distribution. Skewness, described in one of the next points, applies to distribution symmetry. Kurtosis determines the heaviness of the distribution tails.Depending on kurtosis value, we distinguish 3 types:
- platykurtic - for kurtosis smaller than 3
- leptokurtic - for kurtosis greater than 3
- mesokurtic - has the same distribution as normal distribution (kurtosis of 3).
  "kurtosis" should "compute the heaviness of the distribution tails" in {
    import sparkSession.implicits._
    val dataset = Seq(
      (1, 1), (1, 2), (1, 3),
      (2, 1), (2, 2), (2, 3), (2, 4), (2, 5), (2, 6), (2, 7), (2, 8), (2, 9), (2, 10), (2, 11), (2, 12),
      (3, 133), (3, 230), (3, 300),(3, 300),(3, 300),(3, 300),(3, 300), (3, 300),(3, 300),(3, 300),(3, 300),(3, 300)
    ).toDF("nr1", "nr2")

    val result = dataset.groupBy("nr1").agg(functions.kurtosis("nr2" ).as("kurtosis"))
      .map(row => (row.getAs[Int]("nr1"), row.getAs[Double]("kurtosis")))
      .collect()

    result should have size 3
    result should contain allOf(
      (1, -1.5d),
      (2, -1.2167832167832169d),
      (3, 4.2605520290939705d)
    )
  }
last
The opposite for first. last(columnName: String) returns the last element for a group of rows. It's also non-deterministic, so can return different values if the input data is not sorted and has more than 1 partition:
  "last" should "return the last value from the aggregated group" in {
    import sparkSession.implicits._
    val dataset = Seq(
      (1, 11), (1, 12), (1, 13), (2, 21), (2, 22), (3, 31), (3, 32)
    ).toDF("nr1", "nr2")

    val result = dataset.groupBy("nr1").agg(functions.last("nr2").as("last_value")).collect()

    // first is not deterministic, so it can return different values for consecutive runs
    // That's why I'm making here a more complicated assertion on the content
    result should have size 3
    val acceptableValues = Map(1 -> Set(11, 12, 13), 2 -> Set(21, 22), 3 -> Set(31, 32))
    result.foreach(row => {
      val id = row.getAs[Int]("nr1")
      val lastValue = row.getAs[Int] ("last_value")
      acceptableValues(id) should contain (lastValue)
    })
  }
skewness
As kurtosis, skewness(columnName: String) also cares about the distribution. When the function returns 0, it means that the distribution is symmetric, so both tails of the distribution are a mirror image. When the returned value is lower than 0, it means that it's a left skew (peak tends to the left; negative skewness) and if greater, a right skew (positive skewness).
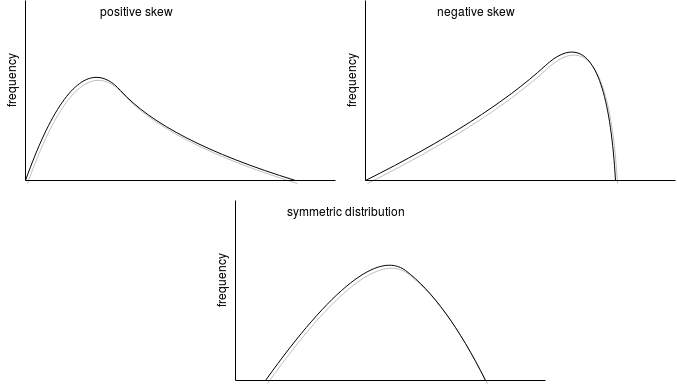
Skewness is helpful to determine the symmetry of the values in a group:
  "skewness" should "compute dataset distribution" in {
    import sparkSession.implicits._
    val dataset = Seq(
      (1, 1), (1, 2), (1, 3), // symmetry
      (2, 3), (2, 23), (2, 1), (2, 50), // right skew
      (3, 3), (3, -23), (3, 1), (3, -50) // left skew
    ).toDF("nr1", "nr2")

    val result = dataset.groupBy("nr1").agg(functions.skewness("nr2" ).as("skewness"))
      .map(row => (row.getAs[Int]("nr1"), row.getAs[Double]("skewness")))
      .collect()

    result should have size 3
    result should contain allOf(
      (1, 0.0d),
      (2, 0.6108295646625682),
      (3, -0.5267113956527112)
    )
  }
stddev_samp
stddev_samp(columnName: String) computes standard sample deviation. A standard deviation measures how much the members of a group differ from the mean value for the group. And since it's a sample, it's also an estimate of the standard deviation of the whole population:
  "stddev_samp" should "compute sample standard deviation" in {
    import sparkSession.implicits._
    val dataset = Seq(
      (1, 1), (1, 2), (1, 3),
      (2, 3), (2, 6), (2, 9), (2, 12)
    ).toDF("nr1", "nr2")

    val result = dataset.groupBy("nr1").agg(functions.stddev_samp("nr2" ).as("ssd"))
    .map(row => (row.getAs[Int]("nr1"), row.getAs[Double]("ssd")))
      .collect()

    result should have size 2
    result should contain allOf(
      (1, 1.0d),
      // Why not 3? Let's compute it with the formulas defined
      // in https://www.mathsisfun.com/data/standard-deviation-formulas.html
      // 1. Mean: (3 + 6 + 9 + 12) / 4 = 30 / 4 = 7.5
      // 2. For each number subtract the mean and square the result:
      // (3 - 7.5)^2 = 20.25
      // (6 - 7.5)^2 = 2.25
      // (9 - 7.5)^2 = 2.25
      // (12 - 7.5)^2 = 20.25
      // 3.work out the mean of those squared differences:
      // 20.25 + 2.25 + 2.25 + 20.25 = 45
      // 1/3 * 45 = 15
      // 4. Take the square root of that
      // √15 = 3.872983346207417
      (2, 3.872983346207417d)
    )
  }
stddev_pop
Like stddev_samp, stddev_pop(columnName: String) computes standard deviation but for the whole population, not a sample. Since the formula presented in the previous test is a little bit different, so the result will be different as well:
  "stddev_pop" should "compute standard deviation" in {
    import sparkSession.implicits._
    val dataset = Seq(
      (1, 1), (1, 2), (1, 3),
      (2, 3), (2, 6), (2, 9), (2, 12)
    ).toDF("nr1", "nr2")

    val result = dataset.groupBy("nr1").agg(functions.stddev_pop("nr2" ).as("ssp"))
      .map(row => (row.getAs[Int]("nr1"), row.getAs[Double]("ssp")))
      .collect()

    result should have size 2
    result should contain allOf(
      (1, 0.816496580927726d),
      (2, 3.3541019662496847d)
    )
  }
var_samp
Standard deviation is also known as the square root of the variance and in Apache Spark SQL, the variance can be computed with var_samp(columnName: String) method. If you remember, the result of standard deviation was √15. To compute variance, you won't execute this last step and therefore, the result will be 15:
  "var_samp" should "compute sample variance of the dataset" in {
    import sparkSession.implicits._
    val dataset = Seq(
      (1, 1), (1, 2), (1, 3),
      (2, 3), (2, 6), (2, 9), (2, 12)
    ).toDF("nr1", "nr2")

    val result = dataset.groupBy("nr1").agg(functions.var_samp("nr2" ).as("var_samp"))
      .map(row => (row.getAs[Int]("nr1"), row.getAs[Double]("var_samp")))
      .collect()

    result should have size 2
    result should contain allOf(
      (1, 1d),
      (2, 15d)
    )
  }
var_pop
var_pop(columnName: String) computes standard variance for the whole population. var_samp, as you can deduce right know after some previously listed functions, applies only to a sample:
  "var_pop" should "compute population variance of the dataset" in {
    import sparkSession.implicits._
    val dataset = Seq(
      (1, 1), (1, 2), (1, 3),
      (2, 3), (2, 6), (2, 9), (2, 12)
    ).toDF("nr1", "nr2")

    val result = dataset.groupBy("nr1").agg(functions.var_pop("nr2" ).as("var_pop"))
      .map(row => (row.getAs[Int]("nr1"), row.getAs[Double]("var_pop")))
      .collect()

    result should have size 2
    result should contain allOf(
      (1, 0.6666666666666666d),
      (2, 11.25d)
    )
  }
Usually, the difference between population and sample is the division denominator which for the former one is the whole size of the dataset (N) and for the latter N - 1.
There are a lot of statistical functions in this list and understanding them is not always obvious. If you are curious about the math formulas behind them, below the post you will find some interesting links (really appreciated statistics how to!) that will give you such a level of detail. Regarding myself, I will soon use some of them to explain aggregations internals.
Data Engineering Design Patterns

Looking for a book that defines and solves most common data engineering problems? I wrote
one on that topic! You can read it online
on the O'Reilly platform,
or get a print copy on Amazon.
I also help solve your data engineering problems contact@waitingforcode.com 📩
Read also about Less popular aggregation functions in Apache Spark SQL here:
- Pearson correlation aggregation on Apache Spark SQL Correlation Coefficient: Simple Definition, Formula, Easy Steps Skew, median and mean Skewed distribution Standard deviation formulas Variance & Standard Deviation Baffled by Covariance and Correlation??? Get the Math and the Application in Analytics for both the terms.. Covariance Kurtosis
Related blog posts:
I'm still amazed by the features of #ApacheSpark #SparkSQL. Today I've just published a post about less known aggregation functions. If kurtosis sounds like a football player, var_pop like a JS variable, the post can shed light on it https://t.co/hc6fLSkgVW
— Bartosz Konieczny (@waitingforcode) September 21, 2019