
Among the many ways to track the progress of Apache Spark Structured Streaming jobs, you'll find custom offset extraction and ingestion into your observability tool of choice. Although this approach sounds simple, it can be implemented in several ways. In this blog post, we're going to discuss two of them: a custom batch job and a custom listener.
What would it take for you to trust your Databricks pipelines in production?
A 3-day bug hunt on a 3-person team costs up to €7,200 in lost engineering time. This workshop teaches you to prevent that — unit tests, data tests, and integration tests for PySpark and Databricks Lakeflow, including Spark Declarative Pipelines.

Konieczny
💡 Several metrics are already available via PrometheusServlet, enabled with spark.sql.streaming.metricsEnabled. If they are not sufficient, or if you are using a different tool for monitoring (e.g. Databricks dashboards), you can apply one of the approaches presented in this blog post.
Listener approach
To help you better understand the first solution, let's take a look at the architecture diagram:
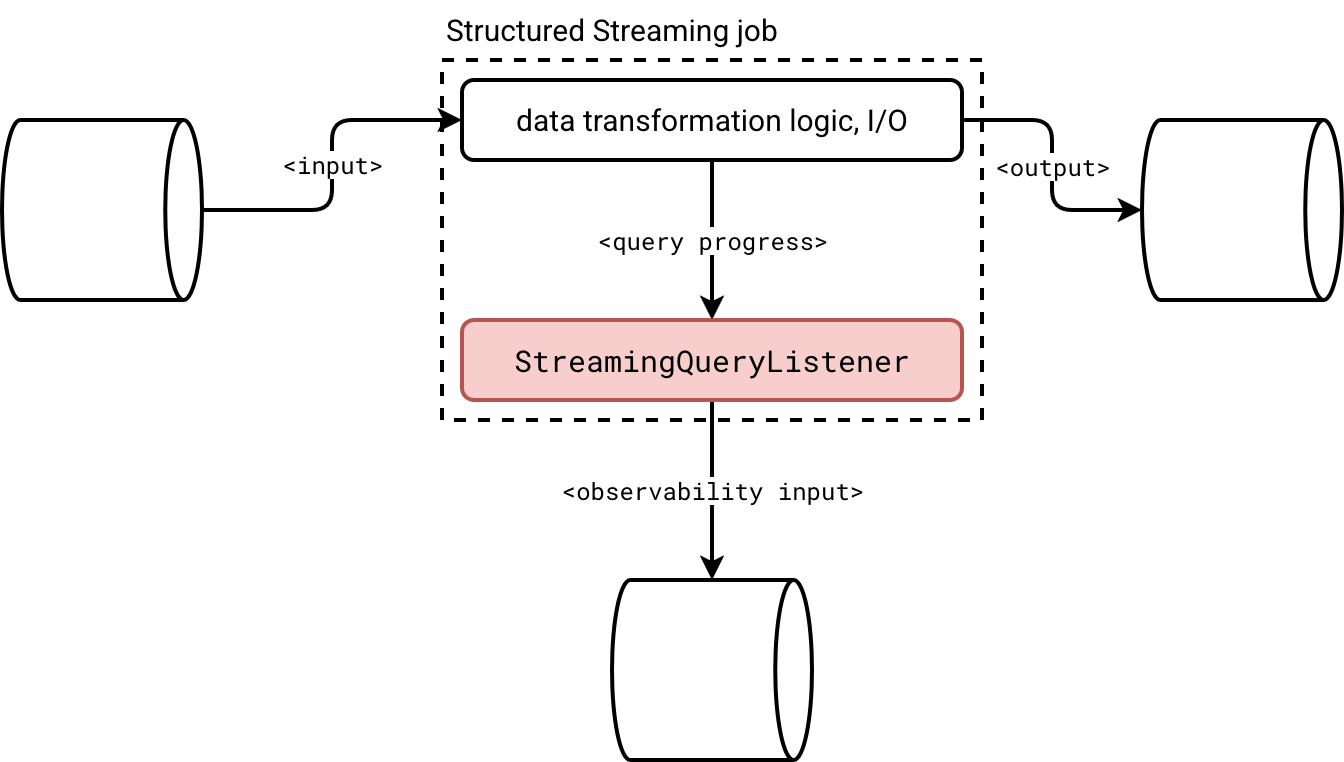
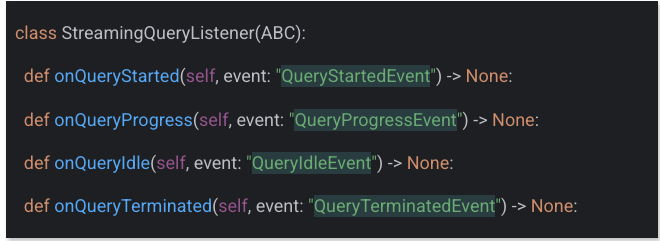
To put it short, you create a class implementing the StreamingQueryListener to intercept four different query states:
I covered the streaming listeners more in detail in the StreamingQueryListener, from states to questions article two years ago. Instead of repeating myself about the execution flow, let me address some practical questions:
- What to do if you have a streaming job combining multiple data sources?
- How to avoid sending too many granular progress updates if you accept a higher latency at the observability level?
The answers are pretty simple. When you deal with multiple data sources, you'll get them directly as part of the sources attribute of the query progress:
def onQueryProgress(self, event: QueryProgressEvent) -> None:
  for source_progress in event.progress.sources:
    processed_offsets = json.loads(source_progress.endOffset)
If you don't want to send many granular updates which is an unnecessary concern if you deal with a streaming broker as the monitoring data sink, you can apply the buffering logic. The listener is a long-living component, i.e. Apache Spark doesn't recreate an instance at each micro-batch. Consequently, you can buffer the events in a list and flush them once a while:
def onQueryProgress(self, event: QueryProgressEvent) -> None:
  if len(self.events_buffer) >= self.buffer_flush_threshold:
    self._flush_records()
An important thing to keep in mind if you decide to buffer events, though. If your query is idle, Apache Spark won't call the onQueryProgress. Consequently, if you want to avoid your events sticking in the buffer for too long, you also should configure a maximal idleness time:
def onQueryIdle(self, event: QueryIdleEvent):
  self.idle_calls += 1
  if self.idle_calls >= self.idle_threshold:
    logging.info("Query was idle for too long. Flushing records...")
    self._flush_records()
    self.idle_calls = 0
Checkpoint job
An alternative to the listener-based approach is an Apache Spark job that consumes checkpoint offset information. Here is the high-level design doc:
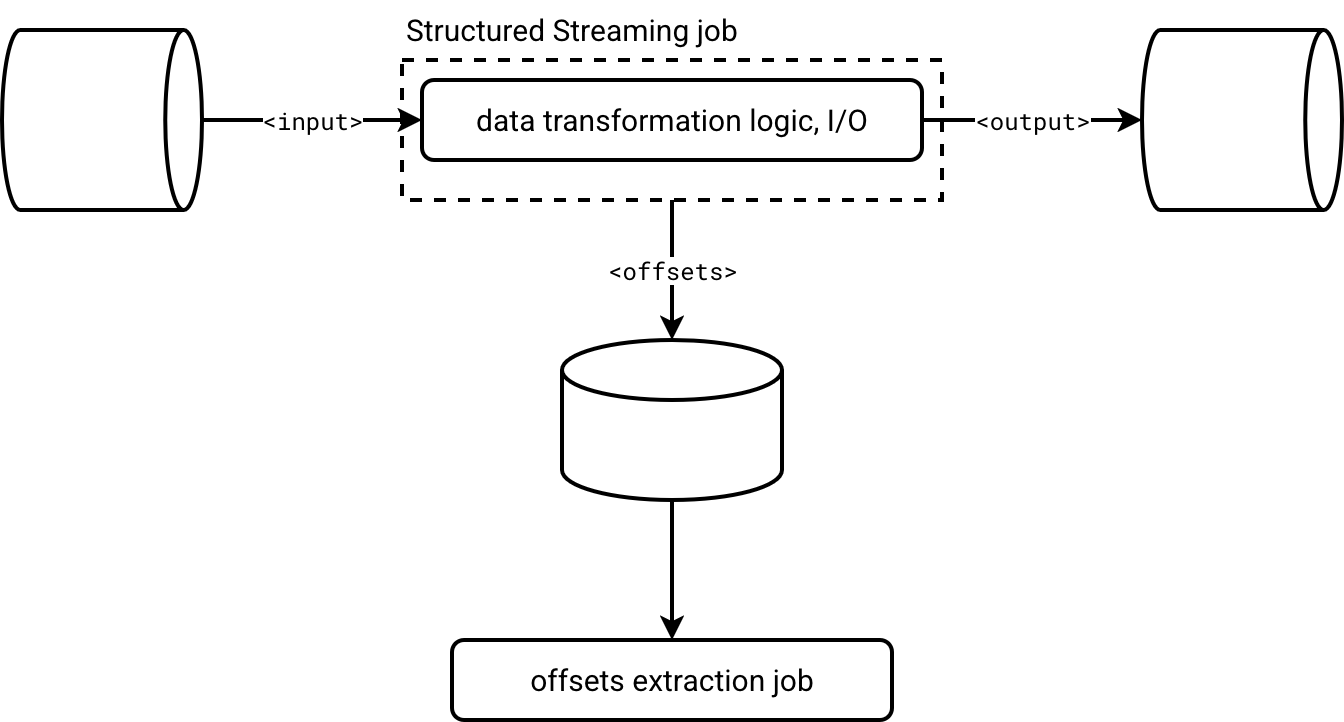
Structured Streaming jobs emit offset information natively, synchronous or asynchronously with async progress tracking. Checkpoint information is materialized as JSON-like files in object storage. Consequently, you can treat them just like any other valid Apache Spark data source and consume them with the data source API.
Below is a short code snippet that processes the offset information from the checkpoint metadata for the case of heterogeneous data sources (a Delta Lake table and an Apache Kafka topic):
offsets = (spark_session.read.text(f'{CHECKPOINT_DIR}/offsets')
    .withColumn('micro_batch_version',
       F.element_at(F.split(F.input_file_name(), "/"), -1).cast('int'))
    .withColumn('progress_source',
       F.when(F.col('value').contains('reservoirId'), 'Delta Lake')
         .when(F.col('value').startswith('{"visits'), 'Apache Kafka')
         .otherwise(None))
    .filter('progress_source IS NOT NULL')
)
Comparison
Now a question should arise in your head, which one to choose? A more Apache Spark-tied listener, or an isolated job? The answer is, it depends. It depends on what you need. It depends on how you want to track the progress tracking failures.
Listener:
- ✅ Good at:
- Detailed tracking information. Generally you get all Apache Spark knows about the micro-batch progress.
- Idleness detection. The listener's API provides an onQueryIdle method to detect any query not making progress. You don't have access to this information directly with the checkpoint job approach.
- Implementation ease. Implementing a listener is easier than writing a custom parser for checkpoint files that embed many JSON lines and some of them are not relevant to the progress tracking. With the listener, Apache Spark gives you exactly what you want, without any additional noise such as checkpoint version flag.
- ❌ Bad at:
- Failures detection. Listeners are designed to be fault-tolerant. It means a failure in your custom listener won't cause failure of other registered listeners. It won't cause a failure of the micro-batch either. That's why spotting an issue is a lot harder than in case of the checkpoint job where your data orchestrator directly notifies you about a failure. With a listener you need to apply a custom detection logic, either in the listener directly, or in the job that parses listeners' events.
- Missed events. If your or one of other registered listeners is too slow, Apache Spark will backlog the pending events until reaching the default 10 000 backlogged elements in the queue. Passing that number, the engine will ignore incoming events.
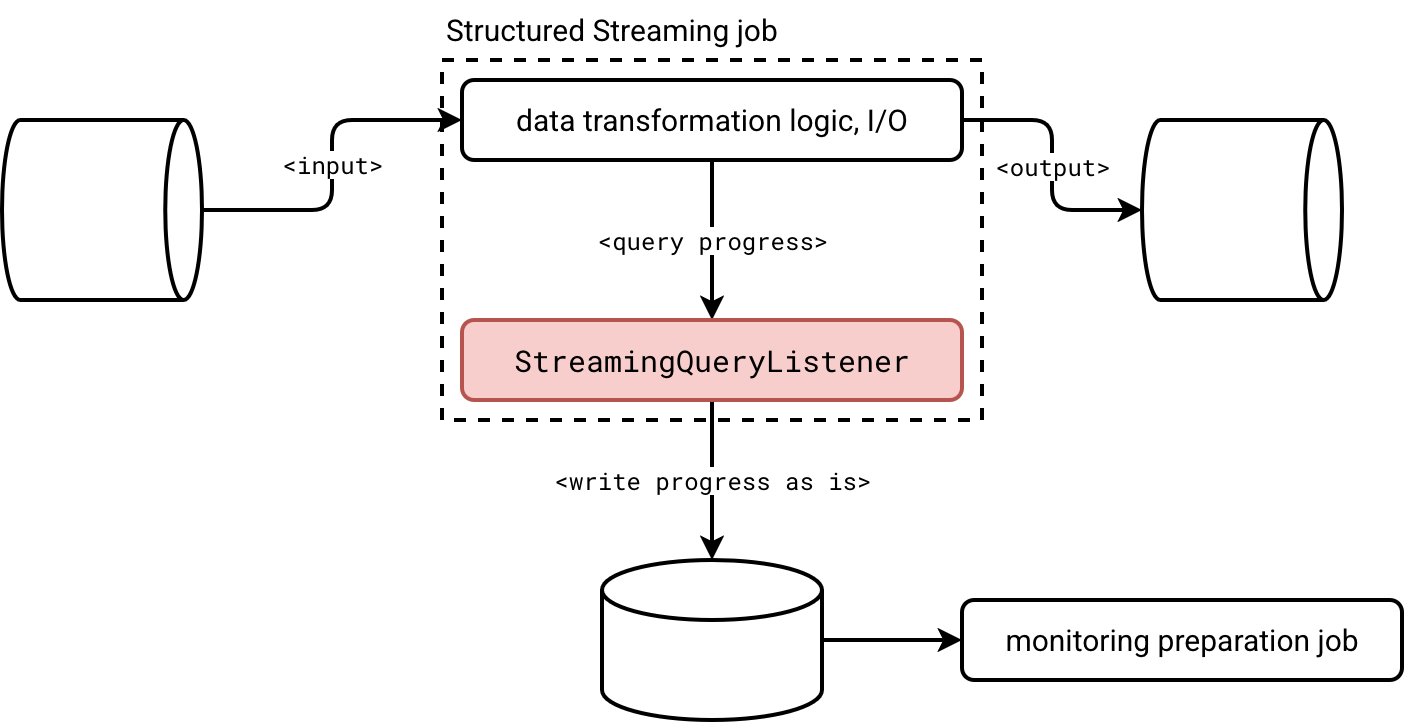
- Coupling. If you need to change anything in the listener, you have to restart the job directly. If your streaming job has strict SLA requirements, built-in listeners are a potential trouble maker. As a solution you could intercept the listener events as is and send them to the observability storage for processing by a dedicated job, as shown in the schema below:
Checkpoint job:
- ✅ Good at:
- Failure management. No need to implement additional failure tracking. If your progress tracking ingestion job fails, it means you need to fix it. Simple as it is.
- Decoupling. The job is not part of the streaming job. Consequently, it won't be disturbed by any slower listeners. This decoupling also guarantees an easier evolution since changing anything in the code doesn't require restarting the streaming job.
- ❌ Bad at:
- Parsing. Parsing checkpoint files requires several hacks. Despite being JSON-like structures, you won't face the same schemas and formats in each line. Here is an example of what you will find for a Structured Streaming job reading, respectively, a Delta Lake table, and an Apache Kafka topic:
v1 {"batchWatermarkMs":0,"...,"conf":{"spark.sql.streaming.stateStore.providerClass":"org.apache.spark.sql.execution.streaming.state.HDFSBackedStateStoreProvider","spark.sql.streaming.stateStore.rocksdb.formatVersion":"5","spark.sql.streaming.stateStore.encodingFormat":"unsaferow","spark.sql.streaming.statefulOperator.useStrictDistribution":"true",...}} {"sourceVersion":1,"reservoirId":"0bc7f5f0-8caf-4754-a7a5-2f28026b8d56","reservoirVersion":1,"index":-1,"isStartingVersion":false} {"visits":{"0":4}} - Identifying data sources. There is no information about the data sources present in the file. You need to use a position-based processing that is always riskier than the name-based logic.
- Missing details. Although you can retrieve last processed offsets per source, you won't get the details like execution time or number of processed rows. Those will be available in Spark UI, or as streaming events.
- Missing events. Structured Streaming has a retention mechanism for checkpoint metadata. If your monitoring job breaks over the weekend and you fix it only on Monday, there are many chances you will miss some progress details. It doesn't happen in the listener approach because the metrics collection is tied to the job itself. [as long as there is no other listener disturbing the whole notification chain]
- Parsing. Parsing checkpoint files requires several hacks. Despite being JSON-like structures, you won't face the same schemas and formats in each line. Here is an example of what you will find for a Structured Streaming job reading, respectively, a Delta Lake table, and an Apache Kafka topic:
Besides these custom methods that might be appropriate if you use a different observability storage, such as a Databricks volume, or an object on S3, you can configure a PrometheusServlet to emit streaming metrics with spark.sql.streaming.metricsEnabled.
Data Engineering Design Patterns

Looking for a book that defines and solves most common data engineering problems? I wrote
one on that topic! You can read it online
on the O'Reilly platform,
or get a print copy on Amazon.
I also help solve your data engineering problems contact@waitingforcode.com 📩
Read also about Listener or checkpoints for external progress tracking? here:
- Custom Kafka Streaming metrics using Apache Spark Prometheus Sink Spark 3.0 streaming metrics in Prometheus
Related blog posts:
- Spark Declarative Pipelines internals
- Spark Declarative Pipelines, going further
- Spark Declarative Pipelines 101