
Defining data quality rules and alerts is not an easy task. Thankfully, there are various ways that can help you automate the work. One of them is data profiling that we're going to focus on in this blog post!
What would it take for you to trust your Databricks pipelines in production?
A 3-day bug hunt on a 3-person team costs up to €7,200 in lost engineering time. This workshop teaches you to prevent that — unit tests, data tests, and integration tests for PySpark and Databricks Lakeflow, including Spark Declarative Pipelines.

Konieczny
To understand how to put the automatic alerts definition in practice, we're going to use the Yellow Taxi Trip Records dataset for January 2024.
If you need to generate some data-related alerts but the dataset is so huge that you don't know where to start, you can opt for various approaches:
- Ask for help. That's probably the easiest solution. It relies on the knowledge of team members who are more familiar with the dataset and who know by their past experiences, what were and what might be the problems once your project hits the production environment. However, they also might have some information bias and be limited to what they saw, without having a fresh perspective.
- Write a prompt. To challenge human suggestions, you can leverage GenAI and after providing the schema of your dataset, ask for more insight about potential data issues. However, you may face data privacy issues or inability to explore bigger datasets this way.
- Analyze the data on your own. But there is a glitch. If you have dozens of datasets to analyze, you will probably not respect the delivery deadline. And even if you do, you'll probably be missing a lot of the issues to monitor because you are in a hurry. Sure, you can write some kind of automated analysis that depending on each column type will generate some statistics with potential alerts. But again, it's time consuming and...somebody already solved this long time ago!
Let me introduce the data profiling! Data profiling analyzes a dataset and creates its summary where you will find metrics like: values distribution, number of rows with missing attributes, or yet the min and max values. That's a great way to familiarize yourself with a new dataset to detect corner cases that might require some special consideration in the data transformation step.
But some data profiling libraries go even further. That's the case of ydata-profiling that besides analyzing the dataset, generates various alerts for each column. Since it's a great feature in our agnostic alerts definition for a big dataset, let's deep delve into it!
🗒 Why agnostic?
In the context of our problem, the alerts are agnostic to the platform and dataset. Put differently, they will work independently on the type of your data (event-driven, transactional, ...) and on the runtime you have (Databricks, AWS EMR, Azure Functions, ...), as long as you stay with Python!
ydata-profiling alerts
When you run a profiling job with ydata-profiling and open the generated HTML rapport, you can access the alerts tab, as shown in the screenshot below taken for the Yellow Taxi Trip Records:
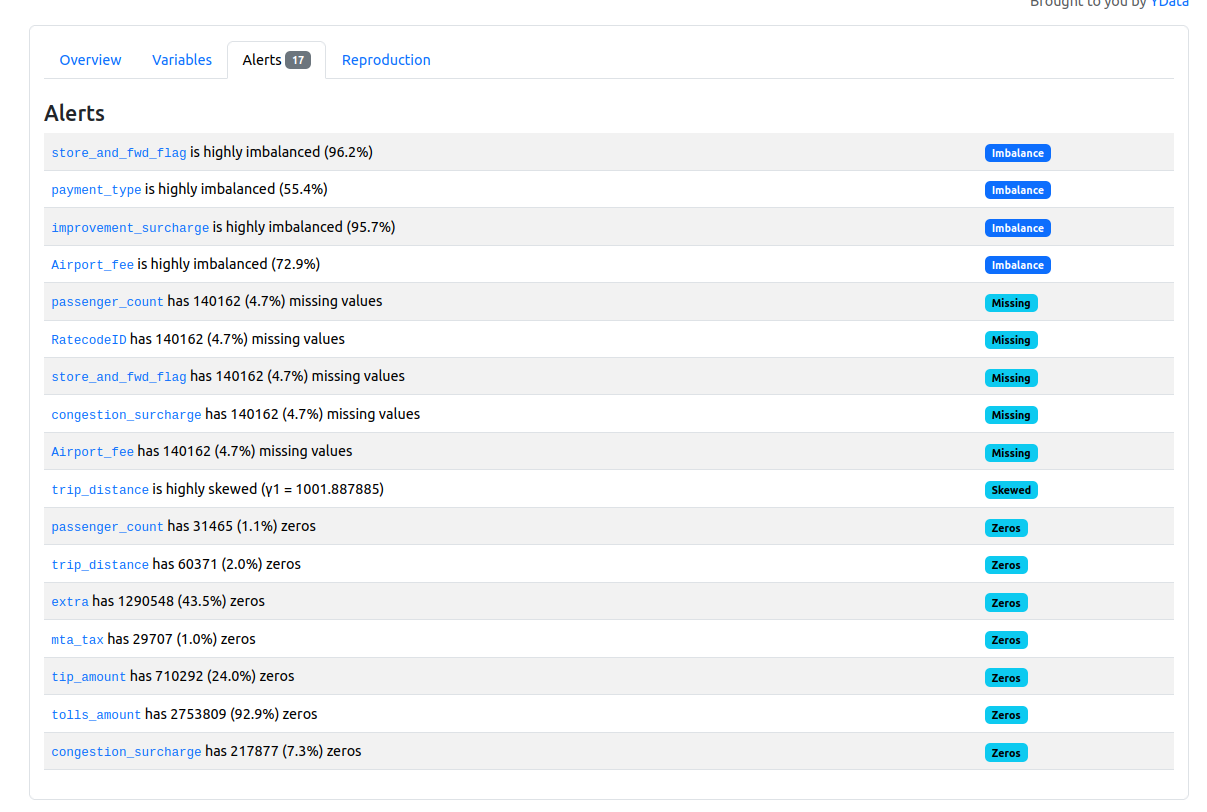
As you can notice, the data profiling job automatically generated some data quality alerts from the analyzed columns. How does this generation work? Let's see by analyzing an example of the JSON data profiling report created from this code snippet:
yellow_tripdata = pd.read_parquet('./yellow_tripdata_2024-01.parquet')
profile = ProfileReport(yellow_tripdata, title="Profiling Report", correlations=None, samples={"head": 0, "tail": 0})
profile_json = profile.to_json()
When you call the code, the ProfileReport generates the alerts part for you by passing through the execution chain from this schema:
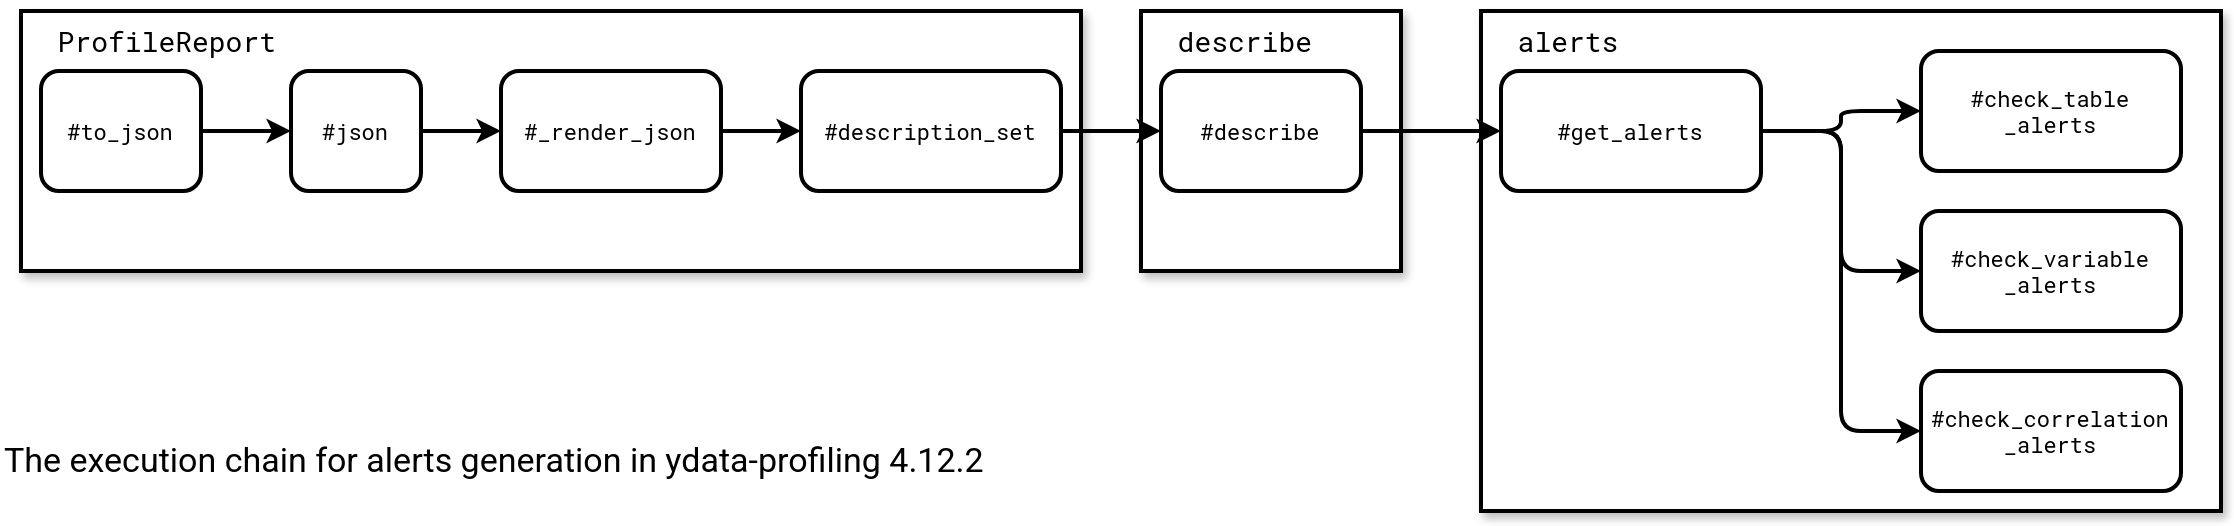
Concretely speaking, the alerts come from the dataset being profiled. The generation is divided in three categories:
- Table alerts. This category includes the alerts that are common for all types of data, such as number of duplicates or empty dataset (number of rows is 0).
- Variable alerts. Here you'll find the alerts generated individually for each data type. For example, the alerts for numeric values will be computed from numeric_alerts function, the ones for booleans from the boolean_alerts function, and so forth so on for remaining two types which are categorical and time series.
- Correlation alerts. Finally, in this part you'll find the alerts related to the correlation between columns, i.e. it helps identify linear relationships. This part helps spotting and addressing multicollinearity issues. For example when you create one column from another existing column and both columns share the same values, the issue should be detected as a correlation alert.
You should now understand the high-level flow for alerts generation. But what about the low level details, especially when it comes to generating the alerts? Each alert is a specific instance extending the Alert class, which is created by one of the three methods mentioned previously. The overall dependency is shown in the snippet below:
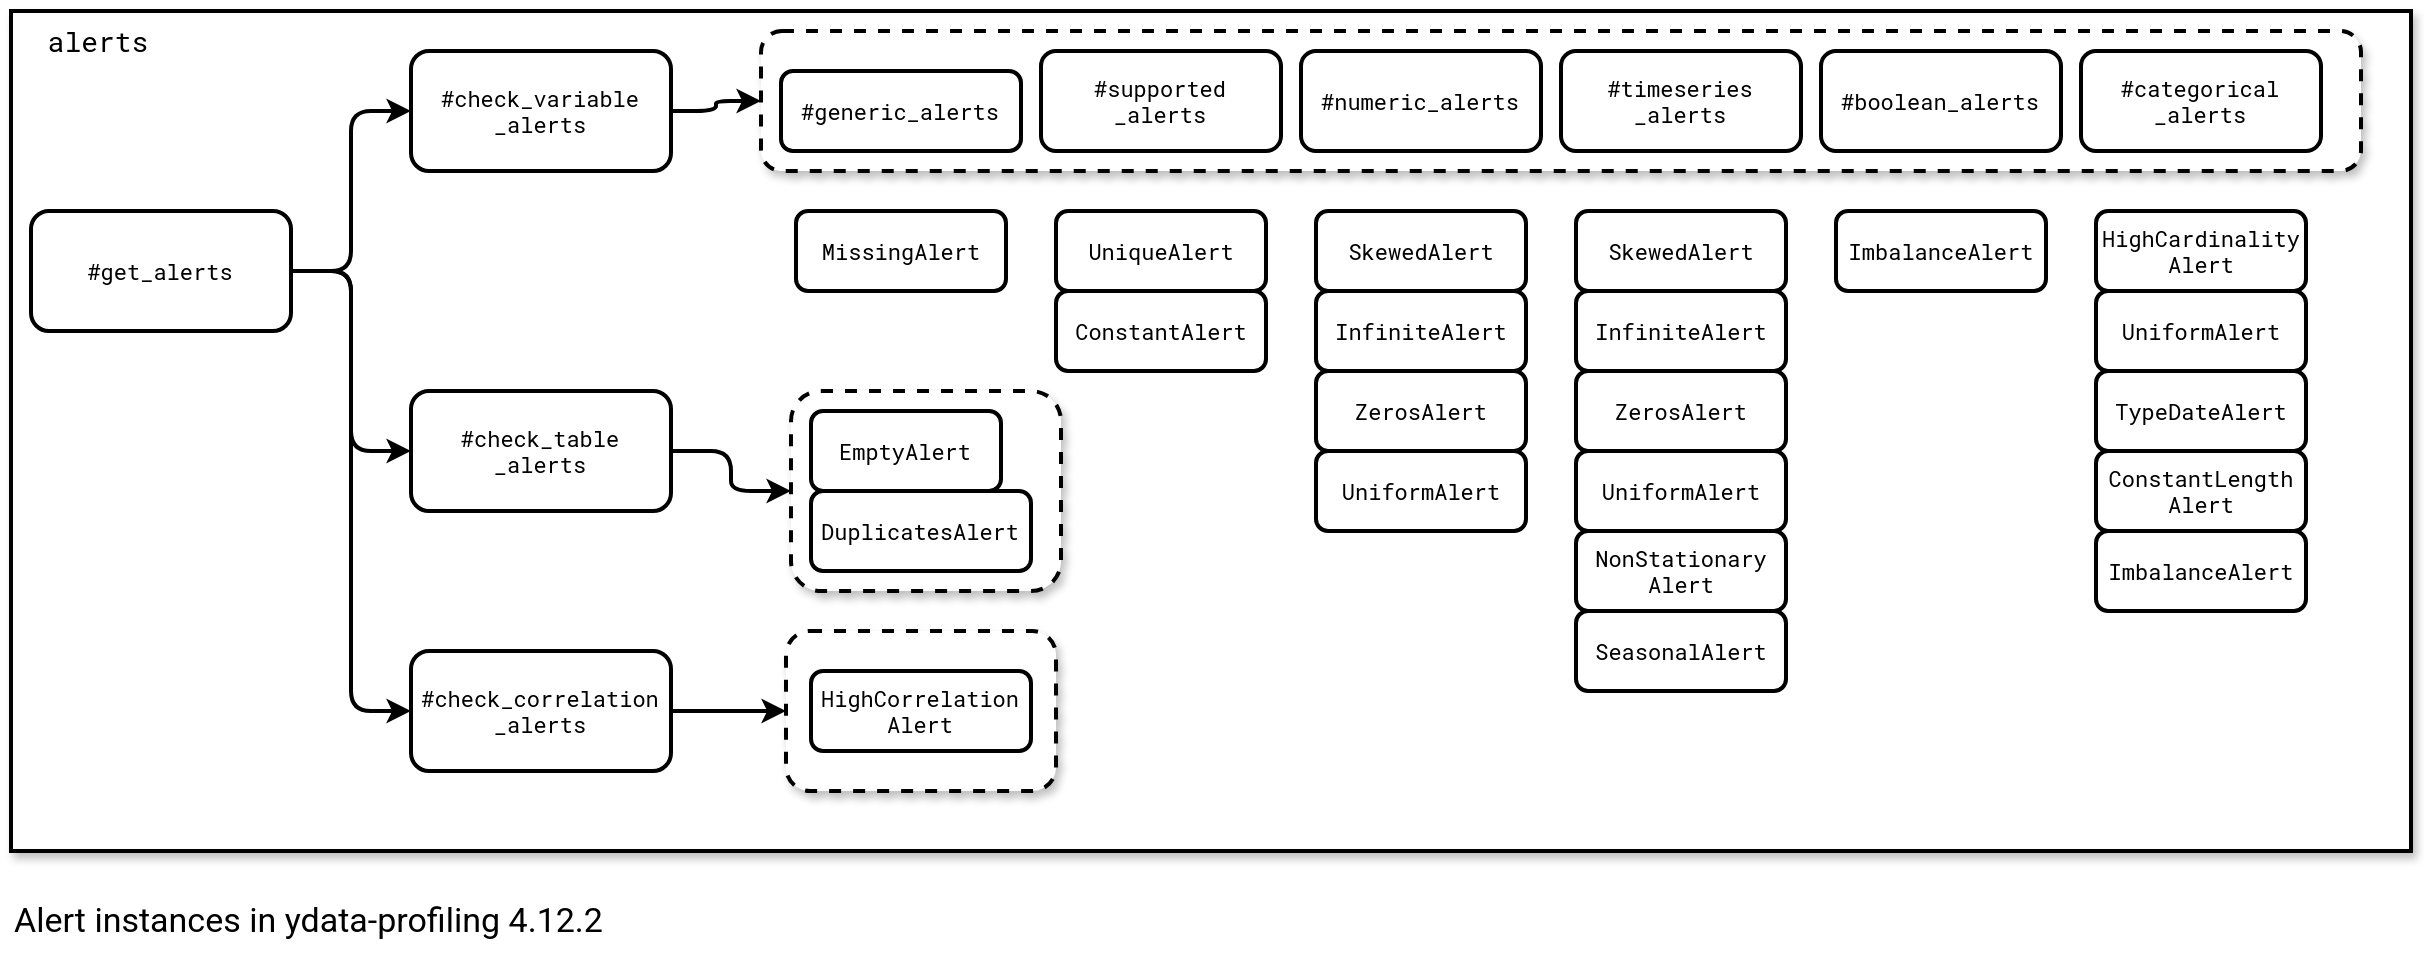
Particular alerts from the diagram rely on some hardcoded models that in some cases can be fine-tuned with custom thresholds. Among the flexible alerts you will find ImbalanceAlert which is configured with a imbalance_threshold for categorical and boolean values, or yet SkewedAlert that depends on the numerics' skewness_threshold parameter. Among the not configurable alerts, you will find EmptyAlert that simply counts the number of rows, or ConstantAlert that checks the number of the distinct values (if 1, then the alerts gets triggered).
Assembling things
In the end of that process you will get:
- Hopefully, some alerts resulting from the domain knowledge.
- Some alerts from the prompt.
- Some alerts from data profiling suggestions.
- Some alerts you might spot on from analyzing the created data profile.
But this is only a raw material where some alerts may be irrelevant, for example:
- A distinct values alert can be irrelevant if it was spotted on an auto-incremented column.
- A duplicates alert can be irrelevant if you are analyzing a regional dataset where the constant value represents the geographical area. As an example, consider analyzing a dataset of people who visited Paris. The column with the visited city will always be set to Paris in that context.
- A skewed alert can be irrelevant if your dataset has some predictable seasonality, such as getting more visits to a website in the evening, or having more sales during business hours.
- An alert suggested by the business user can be irrelevant if his/her knowledge is obsolete. In other words, the dataset has changed and, for example, the column from the suggested alert is not there anymore.
For these reasons, you shouldn't consider the alerts gathered so far as an immutable source of truth. Even the alerts suggested by the domain users might be challenged and become out-of-date over time. Consequently, you'll have to do some filtering work to keep only things that are relevant to the dataset.
But there is another question. Do you really want to have an alerting layer for data quality? Or instead, do you prefer to have a data quality guards, a bit like in the Audit-Write-Audit-Publish pattern I detailed in Chapter 9 of my Data Engineering Design Patterns book? As always, the answer is It depends. As this alerts vs. guards topic sounds intriguing to me, I'll share with you my thoughts on it next time!
Data Engineering Design Patterns

Looking for a book that defines and solves most common data engineering problems? I wrote
one on that topic! You can read it online
on the O'Reilly platform,
or get a print copy on Amazon.
I also help solve your data engineering problems contact@waitingforcode.com 📩
Read also about Agnostic data alerts with ydata-profiling here:
Related blog posts:
- On tests in data systems
- Alerts, guards, and data engineering
- Love and hate - Excel files and data engineers