
As a data engineer you're certainly familiar with data skew. Yes, this bad phenomena where one task takes considerably more input than the others and often causes unexpected latency or failures. Turns out, stream processing also has its skew but more related to time.
What would it take for you to trust your Databricks pipelines in production?
A 3-day bug hunt on a 3-person team costs up to €7,200 in lost engineering time. This workshop teaches you to prevent that — unit tests, data tests, and integration tests for PySpark and Databricks Lakeflow, including Spark Declarative Pipelines.
Konieczny
Its name? Event time skew. To understand it better, let's take an example of a stream-to-stream join between ad impressions and clicks. That's probably the most common example for this kind of joins btw. To do this kind of operation, you need to define a grace period during which all not matched ads will wait for the impressions. For example, if the period is of 10 minutes, it means that for each received ad you'll wait 10 extra minutes hoping to get an impression. If it doesn't happen, it means that probably there is no matching action. The "probably" is quite important. Remember, it's the streaming world where any network issue can lead to the missed matches that eventually wouldn't be present for a batch pipeline having higher latency.
Even though in that scenario we might have some misses, it's an ideal world since there is no long-term and global issue. But let's imagine now the contrary. The impressions are going late. First, they're 20 minutes behind the most recent ads, later 30 minutes, ... until reaching 1 hour. The picture below depicts what happens:
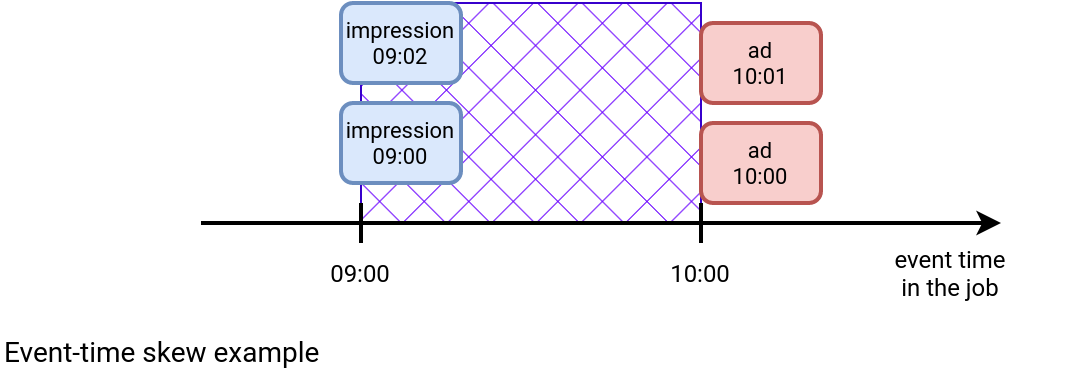
The blue area between the impression and ads shows how many impressions might be missing. What does it mean for a stateful streaming job? If it uses the safer min watermark strategy, it means the accumulation of the ads from 10:00 until the impressions don't advance their watermark to 10:00. But as the ads stream doesn't encounter any issues, it'll only shift the problem to another hour:
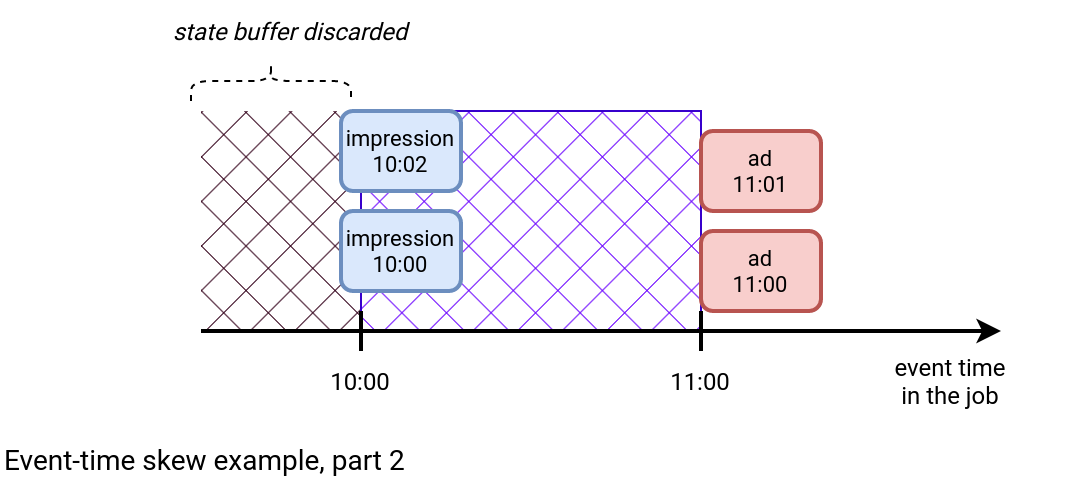
As you can see in the new picture, the state for the join prior to 10:00 is discarded. The join is still late, but now between 10:00 and 11:00. But why does this latency happen? There are multiple possible reasons:
- Delivery issues. The producer can encounter some delivery issues leading to the event time skew. The problems can be related to the network connectivity or simply slower processing.
- Catch-up mode. Your processing job can simply stop working for a longer period of time like a weekend. Upon restart, it requires some catch-up that doesn't go at the same pace for both processed streams.
Now, the question is, how to mitigate the issue? The solution is to speed up the reading on the late stream.
Apache Spark Structured Streaming connector for Apache Kafka has a configuration property called minPartitions. The connector uses the mapping 1-1 by default meaning there is one Apache Spark task consuming one Apache Kafka topic partition. If you increase this value, plus you allow more capacity for a single read in the maxOffsetsPerTrigger, plus you scale your cluster to run the extra tasks in parallel to the previous ones, then you can boost reading the slower stream.
With Apache Flink you can solve the problem differently. The Spark's approach addresses the latency, while the Flink's solution solves the growing state. The withWatermarkAlignment method takes a parameter called maxAllowedWatermarkDrift that determines the allowed difference (aka drift) between sources, tasks or partitions in the same watermark group. Hence, if one of the streams is ahead of that value, Flink will stop reading it to reduce the drift.
Also Apache Kafka comes with a solution mitigating the impact. Confluent innovation labs proposed a Confluent Parallel Consumer library that enables concurrent reading from a single partition.
Even though major data processing tools offer a way to improve the reading time, there is still one important challenge. No, it's not the detection time as the watermark values for the streams should be freely available in the logs or metrics. The biggest challenge is how to switch from the "normal" to the "accelerated" mode automatically. A potential solution involves downtime, so stopping the job, and relaunching it with the upgraded concurrency.
But who knows, maybe in a few months this catch-up mode will be automated?
Data Engineering Design Patterns

Looking for a book that defines and solves most common data engineering problems? I wrote
one on that topic! You can read it online
on the O'Reilly platform,
or get a print copy on Amazon.
I also help solve your data engineering problems contact@waitingforcode.com 📩
Read also about Event time skew in stream processing here:
- How mitigating event-time skewness can reduce checkpoint failures and task manager crashes :Evening out the uneven: dealing with skew in Flink Introducing Confluent labs Parallel Consumer client
Related blog posts:
- Infoshare 2024: Stream processing fallacies, part 2
- Infoshare 2024: Stream processing fallacies, part 1
- Files streaming is quite a challenge
- Stream processing models
- Streamhouse, the next house to move into?