
For a long time, I've wanted to make a small real-time data visualization application with the use of websockets and some fancy JavaScript visualization framework. And the moment went when I was preparing the execution schemas to illustrate distributed graph algorithms covered in Graph algorithms in distributed world - part 1 post. I used there static images combined together but it was quite painful. Because of that, I decided to check whether it's possible to do in a more programmatic way.
What would it take for you to trust your Databricks pipelines in production?
A 3-day bug hunt on a 3-person team costs up to €7,200 in lost engineering time. This workshop teaches you to prevent that — unit tests, data tests, and integration tests for PySpark and Databricks Lakeflow, including Spark Declarative Pipelines.

Konieczny
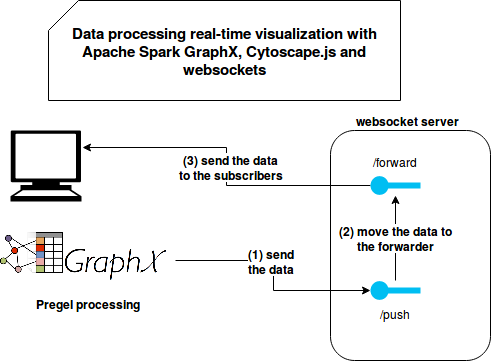
In this post I won't describe every technology in the very fine details as I try to do usually. Instead, I'll show a small POC of the real-time data visualization for the Apache Spark GraphX data processing. In the first 3 sections, I will shortly describe the used technologies. In the 4th one, I will share some encountered problems. In the end, I will summarize the experience with a video showing the POC project in action.
Websockets
In the past I used to work with frontend and backend stacks. It was the age where AJAX was the king. At this time, one of the popular methods to retrieve the data from the server in real-time was the long polling. In this solution, the client normally sends a request to the server. The server, instead of answering directly, blocks the connection and returns a response only when it has new data. However, the blocking in the asynchronous communication is not ideal and primarily it doesn't scale. That's why sometimes the long polling was replaced by client pings sent to the server at some regular interval. It was not blocking but also didn't guarantee low latency.
Only the arrival of HTML5 and websockets changed the game. In simple terms, the websocket connection is established between a client, which in our case is a browser, and a server. The data is sent in a fully asynchronous manner, ie. as soon as the server handles new information it may decide to transfer it to the client without keeping any thread blocked. The client side, at least for JavaScript API, defines the listeners for the specific events sent by the server, like opened connection, closed connection or received message.
In the project I used the websockets in 3 places:
- as a server - since I didn't want to deep delve into the websockets architecture, I slightly modified the websockets example provided by Jetty. The server exposes 2 endpoints: /push and /forward. The former one receives the messages and the latter transfers them to the subscribers, exactly like in any other publish/subscribe mechanism.
- as a backend client - in the backend the client communicates with the /push endpoint. Like for the server, the messages are sent with the Jetty's client API:
localWebscketSession.get().getBasicRemote.sendText(objectMapper.writeValueAsString(triplet))
- as a frontend client - the client is a JavaScript code with the listeners for the opened connection and message reception:
const reader = new WebSocket("ws://localhost:7711/forward");
reader.onmessage = function(event) {
  window.cy.updateGraph(event.data);
}
reader.onopen = function(event) {
  console.log("Connected to /forward endpoint");
}
Cytoscape.js
Let's move now the visualization part. My first thought was oriented toward 3D.js library. However, since I haven't done JavaScript for at least 3 years, I was not ready to use SVGs. The configuration and customization were quite complex. Instead I decided to use Cytoscape.js library which seemed easier to work with.
The Cytoscape.js graph initialization consists of defining a layout, the set of vertices and edges, and the styles for them. The layout is a quite interesting feature because it controls how the vertices will be arranged in the rendered graph. For instance, you can render them as a grid or a circle, or simply let the framework draw them randomly. In the POC I used a DAG layout. The code is quite simple and I let you discover it on my Github. Here, I would only define the way of managing updates:
 const vertices = new Map()
  const edges = [];
  window.cy.updateGraph = function(tripletString) {
    const triplet = JSON.parse(tripletString);
    var sourceVertex = triplet.source,
        targetVertex = triplet.target;
    if (sourceVertex) {
      vertices.set(sourceVertex.id, {group: 'nodes', id: sourceVertex.id, data: sourceVertex});
    }
    if (targetVertex) {
      vertices.set(targetVertex.id, {group: 'nodes', id: targetVertex.id, data: targetVertex});
    }
    if (triplet.edgeValue !== null) {
      edges.push(
        {group: 'edges', data: {source: sourceVertex.id, target: targetVertex.id, value: triplet.edgeValue}}
      );
    }
    window.cy.elements().remove();
    window.cy.add(Array.from(vertices.values()));
    window.cy.add(edges);
    window.cy.layout({name: LAYOUT_NAME}).run();
  }
The updateGraph function is called directly by the websocket client listening to the /forward endpoint. I will detail some important aspects of this part in the section about encountered problems.
GraphX and Pregel
In the project I didn't want to analyze Apache Spark GraphX internals. If you are interested in the details, you can read other articles from Apache Spark GraphX category. Also, I didn't want to test a specific graph algorithm on a big dataset. That's why for the processing part I used the same code as in the post Iterative algorithms with Pregel on Apache Spark GraphX.
The single difference is that the code uses a websocket client to send combined messages to the /push endpoint. Overall, the architecture of the project looks like in the following schema:
Problems
Even though it looks simple, I encountered some problems. The first one was the Error: Blocking message pending 10000 for BLOCKING message appearing during my first tries of sending the data from the executors to the /push endpoint. After some research, I found that the error occurred because of the concurrent use of the websocket client. To avoid any serialization issues and have exactly 1 instance per JVM, I put it into a Scala's object. However, since I was running the code on the Spark local mode (1 JVM, multiple threads), that single instance was shared by multiple threads concurrently. And because it's only a test, I solved the issue by wrapping the session with ThreadLocal instance.
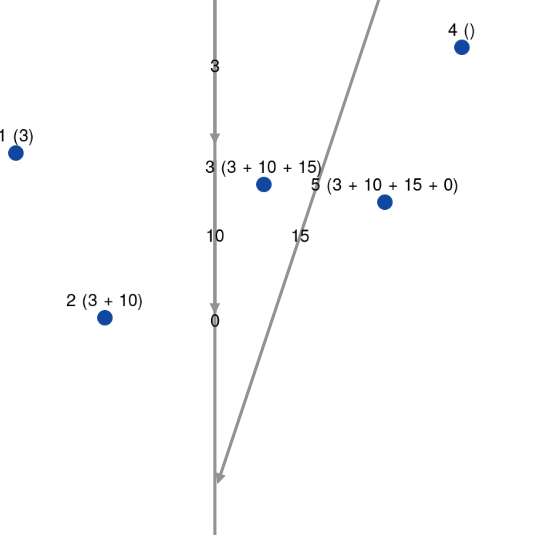
Another issue was related to the Cytoscape updates. At the beginning I wanted to add the new nodes and edges by simply using window.cy.add(...) function. It worked only partially because all new vertices were located at the same position and only the most recent one was always visible. After some reading I found that I was missing the position: { x: ?, y: ? } attribute in the vertices declaration. However, it seemed too much complicated to deal with it for a sample POC project. That's why you can see the graph reset with pretty suboptimal solution redrawing the whole graph every time:
window.cy.elements().remove();
window.cy.add(Array.from(vertices.values()));
window.cy.add(newEdges);
window.cy.layout({name: LAYOUT_NAME}).run()
I also tried to not remove the elements (the 1st line of above snippet). However, it led to a quite strange behavior where the drag & dropped vertex moved without his edges, like here:
Even though it works fine on the small dataset, doing the total recomputation for a bigger one should be more than problematic.
Demo time
It's time to illustrate the previous sayings with a short video. First, I initialize the server. For the sake of simplicity, I do it directly from my IDE. Next, I open the browser with the visualization and verify that the client connected correctly to the /forward endpoint. At the end I launch the data processing pipeline and switch back to the UI to see what happens there:
The POC showed me that real-time data visualization with the use of the websockets is possible. However, depending on the rendered data structure, it may scale poorly. In my case, the graph was small and redrawing it every time was acceptable. I'm pretty sure that it wouldn't be the case of a bigger graph where I would be limited by the physical capacity of my laptop.
Data Engineering Design Patterns

Looking for a book that defines and solves most common data engineering problems? I wrote
one on that topic! You can read it online
on the O'Reilly platform,
or get a print copy on Amazon.
I also help solve your data engineering problems contact@waitingforcode.com 📩
Read also about Visualizing Apache Spark GraphX data processing with websockets and cytoscape.js here:
Related blog posts:
This week I would like to share my attempt to visualize the #data processing in real-time with #ApacheSpark #GraphX, #cytoscapejs and #websockets: https://t.co/Mp8HTlH5Rp
— Bartosz Konieczny (@waitingforcode) February 13, 2019